Download
1 / 39
390 likes | 501 Views
Roanoke Valley-Allegheny Regional Commission June 28, 2012. A multi-year effort :. August 3, 2009—City Council Retreat March 9, 2010—Physical Development Comm. (PDC) April 13, 2010—PDC July 13, 2010—Council Work Session September 28, 2010—City Council Meeting

E N D
Roanoke Valley-Allegheny Regional Commission June 28, 2012
A multi-year effort: • August 3, 2009—City Council Retreat • March 9, 2010—Physical Development Comm. (PDC) • April 13, 2010—PDC • July 13, 2010—Council Work Session • September 28, 2010—City Council Meeting • December 14, 2010—City Council Meeting • January 25, 2011—SWAC recs. To City Council • February 8, 2011—City Council Meeting • March 22, 2011—Council Work Session • April 26, 2011—Council Work Session • September 13, 2011—Ordinance to City Council • October 25, 2011—Public Hearing • December 13, 2011—Ordinance adopted with $0.00 fee • April 24, 2012—Fee adopted with Credit Program (eff. July 1, 2012)
The What, Why, How and When of Stormwater Management April 26, 2011 Council Work Session
The Why • Regulations are increasing • Stormwater services are increasing • Organization is fragmented • Infrastructure needs are unknown • Funding; questions of fairness and equity
Current Chesapeake Bay Regulations Point Source Non Point Source • Stormwater • Erosion and Sedimentation (E&S) • Best Management Practices (BMPs) • NPDES • Wastewater Treatment Plants • Municipal separate storm sewer system (MS4)
Phase II NPDES Stormwater Regulation Lynchburg is in the second year of their second five-year permit cycle First permit issued in 2003 Current permit expires June 30, 2013 Reduce the discharge of pollutants to “maximum extent practicable” (MEP) Protect water quality and aquatic habitat Satisfy the appropriate water quality requirements of the Clean Water Act “Six Minimum Measures” Maximum of $10,000 fine per violation Phase II Purpose The Phase II Rules apply to @ 100 stormwater system operators in Virginia
Chesapeake Bay TMDL The U.S. Environmental Protection Agency is leading a major initiative to establish and oversee achievement of a strict “pollution diet” to restore the Chesapeake Bay and its network of local rivers, streams and creeks. – US EPA Fact Sheet
Chesapeake Bay TMDL • Initiative resulting in additional regulations • 64,000 mi2 watershed • Covers six states • Approximately 17,000,000 people
Lynchburg Impaired Streams • 10 streams (45 miles in length) identified as impaired by the State • Primary impairments • Nutrients • Bacteria
The When- Regulations are increasing • What we know: • MS4 (2013) and VPDES (2016) Permits • CSO Consent Order • General Watershed Nutrient Permit (2011) • State Stormwater Regulations (<2014) • Bacteria TMDL • What we don’t know: • Chesapeake Bay TMDL (WIP Ph. 2, Oct/Nov) • National Stormwater Regulations (2012)
Future Regulatory Impacts to Lynchburg • Chesapeake Bay TMDL and other TMDLs and regulations: • Chesapeake Bay- “pollution diet,” 2-yr milestones begin 2013, 2025 completion date • Revised State stormwater regulations pending (2012) • Bacterial TMDL for the James River and Lynchburg Creeks (2010) • Chlorophyll A TMDL for the James River (pending) • MS4 permit with focus on urban stormwater • National stormwater regulations proposed (2012)
TMDL Timeline $3.2M (proposed) $2.3M (current) $6M $6M $6M $6M Annual cost unknown, total cost approx. $120M over 15 yrs Annual Cost Annual Cost Annual Cost Annual Cost Annual Cost $4M $4M $4M $2M $2M 2018 2011 2012 2013 2014 2015 2016 2017 TMDL Adopted & Phase I WIP EPA Milestone EPA Milestone EPA Milestone, 60% goal & WIP adjustment (i.e. more $$) MS4 Permit renewal Phase II WIP & New State SW Regulations
The Why- Services are increasing • CSO adds 2 miles per year of storm pipe • Public stormwater devices • 16 in 2007 • 40 in 2011 • 20+ under design • Private stormwater devices • Erosion & Sediment Control Program improvements
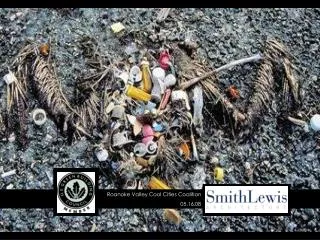
Stormwater Management Affects Quality of Life and Economic Growth:
Compliance Language in City’s NPDES Permit “The failure to provide adequate program funding, staffing or equipment maintenance shall not be an acceptable explanation for failure to meet permit conditions.” 4VAC50-60-1220. of NPDES General Permit
Stormwater Management - A City-wide Function PUBLICWORKS IT DEPT. COMUNICATIONS& MARKETING UTILITIES FINANCE PARKS & REC COMMUNITY DEVELOPMENT SUPPORT LEADING STORMWATERMANAGEMENT
The Why- Infrastructure needs are unknown • What we know: • 50+ miles of storm pipe • 10,000+ inlets and outfalls • 100+ road culverts • No funding for improvements • What we don’t know: • Condition • Age • Location
The How • Organization • Stormwater Utility • Utilities Dept manages program and below ground • New branding; “Department of Water Resources” • Public Works manages above ground • Funding • Implement a fee for service • Implement a credit program • Alternative: General Fund Subsidy (taxes & fees)
Virginia Dedicated Stormwater Funding Programs - Virginia First City • 16 programs have dedicated funding • 13 are fee-based • 3 are tax-based • Two communities have pending fee programs and two are evaluating options
Guiding Principles Provide services that promote the health, safety and prosperity of the city Manage the city’s stormwater needs and infrastructure effectively and efficiently Comply with environmental regulations Engage State and Federal regulators to keep the city well-positioned on future issues Fairly and equitably charge for services provided Educate and engage the public
Benefits of a Stormwater Utility • This is the most effective way to manage stormwater, regardless of TMDLs • More accountability (annual rate study and budget) • Manage stormwater system infrastructure similar to water and sewer systems • Efficiencies gained through better coordination and management
Staff Recommendations: Fair and Equitable • A fee is more equitable than a tax – all properties pay based on impervious area • Credits incentivize good stormwater practices on private property • Property owners can modify their impervious area, tenants cannot • Water/Sewer bill allows 12 equal payments • Reduces burden on General Fund
Staff Recommendations: Efficiency • Finance-Billings and Collections-Utility Billing recommends changing from owner, occupant or tenant billing to all sewer/water/storm billing to owners as recorded on the City’s Real Estate Records Advantages: • Utility Billing maintains and manages all billing records for water, sewer and stormwater utility funds • Administrative Cost Savings can be realized over two year period (see attached spreadsheet for details) • This recommendation was soundly rejected by Council.
Justification of a Higher Level of Service • 3.5 FTEs for PM and O&M $200,000 • Current MS4 permit requirements $100,000 • Buffer Program • GIS Analysis • Private BMP Program • Restore street sweeping effort • Stormwater Utility startup $200,000 • Master Plan work $150,000 • Infrastructure repair/replace $250,000 $900,000
Benefits of a Higher Level of Service • Ensure continued compliance with existing regulations • Keep City well-positioned on future regulations • Address existing infrastructure and stormwater needs more efficiently and effectively • Position City to qualify for grants or loans • Improved customer service • Better water quality
Staff Recommended Funding Mechanisms 2011 Actual- $2.3M Proposed 2012- $2.75M* Proposed 2013- $3.2M *Fee effective for 6 months of FY 2012 Assumes a Utility is created. Thus, funding is from General Fund and VDOT only- no sewer fund money.
Comparison of Funding Mechanisms$3.2M Program Current Funding Methods* SWAC Recommendation Staff Recommendation *Assumes a Utility is created. Thus, funding is from General Fund and VDOT only- no sewer fund money.
Cost to Average Single Family Home Proposed $3.2M Program $2.3M Program *Assumes a Utility is created. Thus, funding is from General Fund and VDOT only- no sewer fund money.
A Tiered Rate Structure is Recommended for Single-Family Residential Customers Tier 1Tier 2Tier 3 Small Single-Family Average Single-Family Large Single-Family < 1,293 Sq. Ft. = 0.5 SFU > 4,257 Sq. Ft. = 1.6 SFU 1,294 to 4,256 Sq. Ft. = 1.0 SFU The Average Single-Family Residential Unit (SFU) in Lynchburg is 2,672 sq. ft.
Non-Residential Customers Should Pay a Fee in Proportion to Absolute Impervious Area Non-Residential Impervious Area SFU = SFU (2,672 sq. ft.) 554,750 sq. ft. impervious area = 208 SFUs
Lessons Learned • Start early • Educate, educate, educate • Hire consultant for technical and public outreach support • Involve the public; SWAC, webcast, print and internet, community meetings • Identify principles and stick with them • Work regionally • Be persistent, consistent and patient