Download

1 / 72
961 likes | 1.53k Views
Nuclear Medicine. SPECT and PET. a good book!. SR Cherry, JA Sorenson, ME Phelps Physics in Nuclear Medicine Saunders , 2012. “tracer”. “projection”. . . (. . ). d. . . y. . I. . I. e. . . (. . ). d. . L. . T. 0. d. . y. . . (. x. ). dx. e.

E N D
Nuclear Medicine SPECT and PET
a good book! SR Cherry, JA Sorenson, ME Phelps Physics in Nuclear Medicine Saunders, 2012
“tracer” “projection”
( ) d y I I e ( ) d L T 0 d y ( x ) dx e L E ( ) d L x y ( x ) e dx E L CT PET SPECT
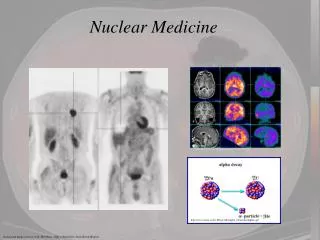
Metabolic images, • characteristics depend on • tracer specificity • tracer sensitivity • detection system
Medical physicist • diagnostics: • QC camera hardware & software • Image formation, reconstruction • Image analysis • (dosimetry) • therapy • dosimetry • research
b- emission 140 keV 99Mo 99mTc 99Tc isomeric transition (6 hours) b- emission (66 hours)
Electron capture 0.0 MeV (2.83 days) EC 0.4167 MeV g1 0.2454 MeV g2 0.0 MeV (stable)
Positron or b+ emission 11C + - 511 keV positronium 511 keV 180o
Radioactivity 1 mCi = 37 MBq = 37 x 106 events per s
Poisson noise Chance of measuring n photons when l are expected : Poisson distribution resembles Gaussian
Poisson noise SNR = n1 Poisson(l1) n2 Poisson(l2) n1+ n2 Poisson(l1+ l2)
Photon-electron interactions Detectors pair production photo-electric Compton Tissue
attenuation scatter photoelectric effect
water Photoelectric Compton Rayleigh Pair
Energy loss due to Compton scatter E’ 511 q E -10% 140
attenuation N(b) N(a) b a a c b Single photon Positron
Scintillation time
Scintillation crystals NaI(Tl) BGO LSO GSO LaBr:Ce Photons/keV 40 5..8 20..30 12 60..70 decay time [ns] 230 300 40 65 16..20 lin.att.coeff @ 511keV [/cm] 0.34 0.95 0.87 0.67 0.47 wave length 410 480 420 440 380 melting point651 1050 2050 1950 783 transparency, ease of use...
Detector design Single crystal multi- crystal
Position and energy measurement x,y,z Electronics output current X Y
Multiple events x,y,z Electronics output current All wrong
Intrinsic resolution x,y,z Electronics Y X FWHM NaI(Tl): 4 mm Collimator Source
Expensive alternatives • APD: avalanche photo diode • diode in reverse mode • replaces PMT, much smaller, low voltage • works in high magnetic field • Cd Zn Te detectors • direct detection of high energy photons • excellent energy resolution • high stopping power
Partialvolumeconstantconcentrationfinite resolution Recovery Spill-over perfect resolution finite resolution
( ) d y I I e ( ) d L T 0 d y ( x ) dx e L E ( ) d L x y ( x ) e dx E L CT PET SPECT
Collimator Lens Collimator
Collimators Parallel Fanbeam Cone beam Pinhole
Collimator PSF counts FWHM position
Collimator sensitivity R H a r Sens T S pMol! PSF(r) r
Collimator sensitivity FWHM H a T
Electronic collimation r x psf d x r d x psf
PET sensitivity sensitivity in center: R d
PET resolution max max mean Mev mm mm 11C 0.96 3.9 1.113N 1.19 5.1 1.515O 1.72 8.0 2.518F 0.64 2.4 0.668Ga 1.90 8.9 2.982Rb 3.35 17 5.9 511 KeV 2.5 mm (for 1 m FOV) 0.3o 511 KeV
Coincidence detection True Scatter Single Random
PET septa r T d D r efficiency:e time window:t trues: singles: randoms: scatters: