Download
1 / 51
510 likes | 602 Views
Software and System Reliability Concepts to Assess and Improve Products and Their Underlying Product Development Process Hewlett Packard February 15, 2006 Dr. Samuel Keene, FIEEE s.keene@ieee.org . Dr Samuel Keene, FIEEE. Six Sigma Sr Master Black Belt Past President of IEEE RS

E N D
Software and System Reliability Concepts to Assess and Improve Products and Their Underlying Product Development Process Hewlett Packard February 15, 2006 Dr. Samuel Keene, FIEEE s.keene@ieee.org
Dr Samuel Keene, FIEEE • Six Sigma Sr Master Black Belt • Past President of IEEE RS • HW, SW and System Reliability • Reliability Engineer of the Year in 1996 • Reliability Engineer, Consultant, and Educator • Education: Physics (BS and MS), Operations Research, and MBA
ho·lis·tic (h -l s t k) • Emphasizing the importance of the whole and the • interdependence of its parts. • b. Concerned with wholes rather than analysis or separation • into parts: holistic medicine; holistic ecology. Note: Safety, security, reliability, and survivability are system attributes
The whole is more than the sum of its parts • Hardware reliability • Hardware to software reliability comparison • System concepts • Software reliability concepts • Measuring Software reliability • Building more reliable software and systems • Managing variation Recent Ref: The Quest for Imperfection, Machine Design, 10.5.5 (C, Misapplied measurements and focus)
Notorious Failures (assignable cause) • Patriot missile misfire (1991) operational profile change • Jupiter Fly by – Programmed to switch power supplies if communication not received within in 7 days (15 year mission) • Mars Climate Orbitor (1998) mix of metric and Imperial units • DSC Communications failure (1991) – 4 bits changed in 13 LOC but not regression tested
Allegedly, The first time the F-15 Crossed the equator Normal Everyday Flight?
One more special cause driven reliability problem Pfizer Pharmaceutical products were experiencing intermittent failures in a Paris operating room On site investigation revealed that a doctor’s cell phone was infringing on Pfizer’s medical equipment Solution: redesign chassis covers reducing the orifices (holes) in the equipment covers to block radiation
Wearout Random l(t) Time Bath tub curve • The slope provides insight into the failure mechanism Infant Mortality b> 1.0 b < 1.0 b =1.0
Hardware failures are special cause driven also • History: • Parts count • Mil Hnbk 217 • Part type • Stress • Some application factors • My IBM FA experience • PRISM model
Reliability Prediction Failure Analysis Experience • My IBM Failure Analysis experience • Pareto (80-20) effect observed • Special Cause vs Common Cause • Actually, a 99-01 % breakdown of parts experiencing reliability problems
Prism Reliability Model • Based upon extensive military and commercial field return data modified by broad spectrum of expert application factors, (e.g., EMC related questions): • Are the equipment orifices smaller than 1/10 emission wavelengths exposure? • Will the product be EMC certified by EU for emissions and susceptibility? • Do traces on alternate layers run orthogonal to each other? • Are adjacent traces separated by twice their width? • Plus 5 additional EMC application questions Built in best practices and lessons learned
The path to failure E.g. F(x) = 1/(x+234); well behaved except at x = -234 Programming error can occur anywhere in the process from requirements development to test
A + B = C 1 + 0 = 1 + 1 = 1 + .5 = 1 + A =
Software Maintenance • Perfective changes – adding functionality, which might be • new or overlooked • Adaptive – to have the code work in a changed environment • Corrective – fixing bugs • Preventive – preclude a problem
Reliability Failure Intensity Time
Operational profile • Established definition:Operational profile is the set of input events that the software will receive during execution along with the probability that the events will occur • Modified definition:Operational profile (usage) is: (1) the set of input events that the software will receive during execution along with the probability that the events will occur, and (2) the set of context-sensitive input events generated by external hardware and software systems that the software can interact with during execution. This is the configuration (C) and machine (M). One could also add in the operator variation (O) on impacting the software reliability.
Conventional test FI/FIO Operational-profile-driven test reaches FIO faster Mcalls Reliability Estimation during Testing
CASRE model selection rules for picking the “best fit model” • Do a goodness-of-fit test (i.e., KS or Chi-Square) on the model results • Rank the models according to their prequential likelihood values (larger) • -ln(Prequential Likelihood), though, smaller is better • In case of a tie in prequential likelihood, break the tie using the values of model bias • In case of a tie in model bias, break the tie using the values of model bias trend • Optional - in case of a tie in model bias trend, break the tie using model noise From Dr Allen Nikora, NASA JPL, CASRE Developer
Software Reliability Predictive Models • Model NameData Inputs • Keene KSLOCs; SEI Level; fault density; years to maturity • Musa Basic Error count; time of error detection • Musa Logarithmic Error count; time of error detection • Shooman Error count; time of error detection • Jelinski-Moranda Error count; time of error detection • Lipow Error count; time of error detection; intervals • Goel-Okumoto Error count; time of error detection; intervals • Schick-Wolverton Error count; time of error detection • Dual Test Common error count; error count from both groups • Weibull Error count; time of error detection • Testing Success # of test runs successful; total # of runs
Raleigh Model Reliability Prediction Based on Profile of Development Process Defect Discovery Requirements Design Code Unit Test System Test Operation Process/Product Characteristics Estimation & Development Faults/Failure Data Collection Early-Stage Prediction Code-Phase Prediction Unit-Test Phase Prediction Operation Phase Prediction System-Test Phase Prediction Software Reliability Estimation/Performance Evaluation
Inspection Exercise • Task: You have 60 seconds to document the number of times the 6th letter of the alphabet appears in the following text: The Necessity of Training Farm Hands for First Class Farms in the Fatherly Handling of Farm Live Stock is Foremost in the Eyes of Farm Owners. Since the Forefathers of the Farm Owners Trained the Farm Hands for First Class Farms in the Fatherly Handling of Farm Live Stock, the Farm Owners Feel they should carry on with the Family Tradition of Training Farm Hands of First Class Farmers in the Fatherly Handling of Farm Live Stock Because they Believe it is the Basis of Good Fundamental Farm Management.
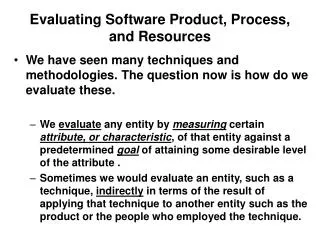
The Reality Quantitatively measuring software quality is more like finding flaws in silk than measuring the size of pearls or the firmness of fruit
Time Assertion • Software does not wear out over time! If it is logically incorrect today it will be logically incorrect tomorrow • Models need to consider the quality of the test cases and complexity of the software • e.g., 1 LOC vs. 1M LOC
Reliability Focus • “System Management” Failures (Brandon Murphy) • Requirements deficiencies • Interface deficiencies • The best products result from the best development process, example, “The defect prevention process” used by IBM to be the first to achieve SEI Level 5 for their SW development process.
Satisfaction Specified Unexpected (Unspoken) Requirement Unfulfilled Requirement Fulfilled Expected (Unspoken) Dissatisfaction Customer Fulfillment: Kano Diagram
Conclusion: Design, Software, Requirements Capture, and the Development Process (especially the quality of communications) made a big difference in reliability!
Keene Process-Based (apriori) SW Reliability Model • Process Capability (SEI Level) • Development Organization • Maintaining Organization • Code Extent (SLOC) • Exponential growth to a plateau level • Historical Factors • R growth profile • Usage level • Fault latency • % Severity 1 and 2 failures • Fault activation rate • MTTR
Fault Profile Curves vis a vis the CMM Level • I have observed a 10:1 variation in latent fault rate among developers of military quality systems • The best documented software fault rate has been on the highly touted space shuttle program. It has a published fault rate of 0.1 faults/KSLOC on newly released code (but this is only after 8 months of further customer testing) • The fault rate at customer turnover is 0.5 faults/KSLOC based upon private correspondence with the lead SS assurance manager. • The entire code base approaches 6 sigma level of fault rate or 3-4 faults/KSLOC. Boeing Missiles and Space Division, another Level 5 Developer, told me they have achieved like levels of fault rate in their mature code base.
Mapping of the SEI process capability levels (I,II,III,IV,V) against probable fault density distributions of the developed code (Depiction) Level 1: Initial (adhoc) Level 2: Repeatable (policies) Level 3: Defined (documented) Level 4: Managed (measured and capable) Level 5: Optimized (optimizing)
Synonyms • Keene Process Based Model same as the Development Process Model (Smith) • SWEEP (SW Error Estimation Process) developed by Software Productivity Consortium is an implementation of the Raleigh (Smith). Raleigh prediction model developed by John Gaffney of IBM.
Development Focus Rigorous Development Process Requirements Capture “Voice of the Customer” Prototypes Lessons Learned High Level Flow Diagrams Data Descriptions Architecture Firewalls Partitions Safe Subset of Language
Development Focus Continued Safety Emphasis is Number 1 FTA FMEA Clean Room Approach Development Cross Functional Team Design Reviews Walkthroughs, Inspections Built in Safety Monitor Robust Human Interface
Development Focus cont. Fault Avoidance Fault Tolerance FMEA PFMEA DPP ****** Failure Review Board Manage Failure/Anomaly Logs Fault Insertion Customer Feedback Alpha Testing Beta Testing
COTS challenge • Assure interoperability of COTS: incompatibility of data format, protocol, operating assumptions • Version compatibility, migration and extensibility • Vendor responsiveness • Vendor participation and cooperativeness
Visualizations: Flow Graphs (devise tests, reduce coupling, manage complexity, prioritize analysis and verification) Entity Relationship Diagrams State Transition Diagrams Data Structures Swim Lane Diagrams Message Handling Diagrams GUI Screens Prototypes User Feedback Data Flow Diagrams
Looking at Failures 1. Failures cluster In particular code areas In type or cause 2.All failures count – don’t dismiss 3.Prediction models count test failures only once during testing; but every failure in the field 4.Software development has been said to be a “defect removal process”
Software changes degrade the architecture and increase code complexity Design for maintenance
Small Changes are Error Prone LOC ChangedLikelihood of error 1 line 50% 5 lines 75% 20 lines 35% Classic Example: DSC Corp, Plano Texas, 3bits of a MSLOC program were changed leading to municipal phone outages in major metropolitan areas Edwards, William, “Lessons Learned from 2 Years Inspection Data”, Crosstalk Magazine, No. 39, Dec 1992, cite: Weinberg. G., “Kill That Code!”, IEEE Tutorial on Software Restructuring, 1986, p. 131.
Good design practices • Design for change • Question requirements • Design for “nots” as well as “shalls” • FMEA • Use and maintain documentation, eg flow graphs, control charts, entity-relationship diagrams,… • Question data
FAILURE MODE AND EFFECTS ANALYSISProduct Panel Assembly Process Date ______Team Members ________________ Page of
Samuel Keene Why Testing Under Expected Operational Scenarios is Not Sufficient
Software Fault Injection • A form of software testing • Not statistical testing, Not correctness proofs • “What-if Game” • The more you play, the more confident you can become that your software can deal with anomalous situations – Unanticipated Events • Determines the consequences of Incorrect code or input data • Crash testing software