Download
1 / 14
140 likes | 264 Views
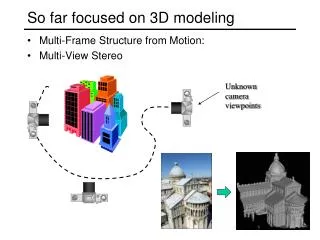
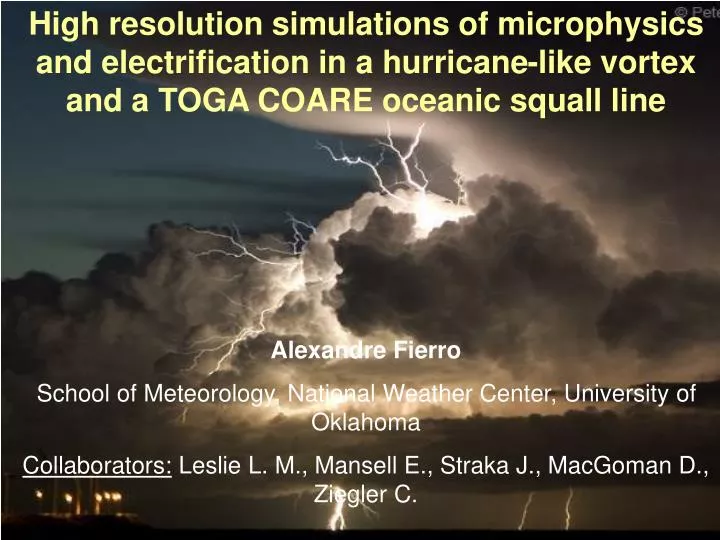
High resolution simulations of microphysics and electrification in a hurricane-like vortex and a TOGA COARE oceanic squall line Alexandre Fierro School of Meteorology, National Weather Center, University of Oklahoma Collaborators: Leslie L. M., Mansell E., Straka J., MacGoman D., Ziegler C.

E N D
High resolution simulations of microphysics and electrification in a hurricane-like vortex and a TOGA COARE oceanic squall line Alexandre Fierro School of Meteorology, National Weather Center, University of Oklahoma Collaborators: Leslie L. M., Mansell E., Straka J., MacGoman D., Ziegler C.
Motivationcontinued • No work done so far in terms of modeling lightning in these systems • This study will provide a first insight of electrical properties in those systems (spatial charge distribution of charge and charging rates) Rita Katrina • Also.. • Deepening of the TCs is often accompanied by CG (and verylikely IC) lightning bursts in eyewall (e.g., Molinari et al. 1994) Plots from Shao et al. 2006
Quick Model Description • Straka and Mansell (2005) 12 bulk hydrometeor categories • (Inverse exponential distribution): • cloud, rain, snow, ice (3 habits), graupel (4 densities), hail • (2 sizes) • 3-D branched lightning parameterization (Mansell et al., ,2002) with electric field initiation threshold, corona discharge and explicit treatment of small ions • Includes 1 inductive and 5 NI charging parameterizations 2-D Lightning grid Negative leader Initial Breakdown Positive leader -CG
1.Tropical oceanic squall line simulation • 9th February 1993 TOGA COARE “ship” from Petersen et al. 1999 obs. • Δx = Δy = 600 m, Δz stretches from 100 m to 600 m above 7 km in a 132 x 210 x 22 km domain • -7 K bubble (20 x130 x 2 km) • CAPE/CIN = 1750 /10 J/kg • Nearly moist adiabatic • Westerly LLJ of 12 m/s near 800 mb • SP98 NI charging scheme • Moderate inductive charging strength
Results: -1 K • Note: winds rotated 50° clockwise & domain rotated by 90° for display orientation of line nearly NW-SE • Starts as a solid meridional line of convection. • System total lightning activity of 3 –CGs and 1050 ICs: greater than obs (only 1C within range of field mill aboard the ship) • Lifetime = 5 h, similar to obs.
Line-averaged plots (Y = 90 to 120 km) • 30 dBZ echo contour (with black contour) well within mixed phase layer (ML: 0-20°C). W • Stronger updrafts in / above ML (and larger Qg values) in “mature zone” (Y=67km) • Rapid depletion of LW ahead of line (fast coalescence) • Stratiform region largely glaciated (snow & ice crystals) • Expect bulk of lightning activity in mature zone Run
Individual cross sections for charging + _ + _ + _ • Charge structure in mature zone resembles a normal tripole (+ - +) • Upper positive and midlevel negative charge region: NI • Lower positive layer: induction (largest liquid precipitation mixing ratio) & NI • Most of the charge in stratiform region acquired Non-inductively in situ
Individual cross sections for charging ctd.. • Mid-level neg. charge region attributed to (NI) charging of cloud ice and graupel • Upper level + charge attributed to + (NI) charging of cloud ice • Lower + charge region attributed to + NI and + inductive charging of graupel • LW quickly depleted towards the rear of the line below 0°C limits charging magnitude in mixed phase region.
2.Tropical Cyclone simulation • Composite of 00UTC 13th August 2004, at Owen Roberts airport, Grand Cayman and 00 UTC Kingston, Jamaica (above 15km). (Hurricane Charley) • Δx = Δy = 2 km, Δz stretches from 200 m to 600 m above 7 km in a 600 x 600 x 25 km domain • moisture/sensible heat sfc flux of Rotunno and Emanuel (1987) • Homogeneous SST = 28°C • Rankine type bogus vortex of max winds ~ 44 m/s • SP98 NI charging scheme • Moderate inductive charging CAPE: 1473.6 J/kg CIN : 99.2J/kg Reduced LL CAPE moist adiabatic Saharan layer Added CIN
Results (at 21 h 40 min) • Well defined eye and eyewall (min psfc=952 mb) • 3 main connecting rainbands • Asymmetric eyewall • Bulk of total CG activity located in NW quadrant • Exclusively –CG except 1 +CG in rainband • IC rate ~ 300 / min + 21h40 30 min CG composite
Charge structure generally very complex: • IF only considering region > 0.4 nC m-3 (i.e., involved in lightning, see later) • Normal tripole in eyewall (+ - +) • Strongest cells in rainband exhibit normal dipole (+ -) Charge density (nC m-3) + + - + - + + -
Charging (pC m-3 s-1) Midlevelnegative charge structure: NI charging Upper levelpositive charge structure: NI charging Lower level positive charge structure: Both NI and induction Positive (negative) contours are shown by the red (blue) contours by increments of 2 starting at pC m-3 s-1.
+/- lightning channels • Lightning initiation found at 2 levels: ~7 km and ~10 km • The -CG flashes in eyewall propagate through the inductively and Noniductively generated lower positive charge region. • Positive leader channels found at lower levels in rainband cell (but rarely reach ground)