Download
1 / 20
210 likes | 725 Views
Precipitation Reactions and Titrations (1). 213 PHC 5 th lecture. (1) Gary D. Christian, Analytical Chemistry, 6 th edition. By the end of the lecture the student should be able to:. Understand the regions of precipitation reaction titration curve.

E N D
Precipitation Reactions and Titrations (1) 213 PHC 5th lecture (1) Gary D. Christian, Analytical Chemistry, 6th edition.
By the end of the lecture the student should be able to: • Understand the regions of precipitation reaction titration curve. • Select a suitable indicator for precipitation reaction.
Titration Curves The titration curve is constructed by plotting pX against the volume of titrant.
Titration of Cl- with standard AgNO3 solution: • At the beginning of the titration, only 0.1 M Cl- present (pCl = 1). • As the titration continues, part of Cl- is precipitated as AgCl (pCl = -log [Cl-] remaining). • At the equivalence point, we have a saturated solution of AgCl (pCl = 5). • Beyond the equivalence point there is excess Ag+ ([Cl-] = Ksp / [Ag+]).
The smaller the Ksp, the larger the break at the equivalence point (sharper end point). AgI has the lowest solubility, so [I-] beyond equivalence point is smaller and pI is larger. The Ksp of AgCl = 1x10⁻¹⁰ AgBr = 1x10-13 AgI = 1x10-16
At the equivalence point [X-] is smaller for the smaller Ksp values and pX is larger for a saturated solution of the salt. Beyond the equivalence point [X-] is smaller when Ksp is smaller resulting in a large jump in pX.
The overall effect is: A larger pX break at the equivalence point when the compound is more insoluble (Ksp small).
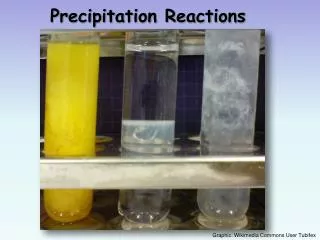
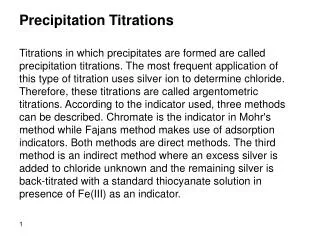
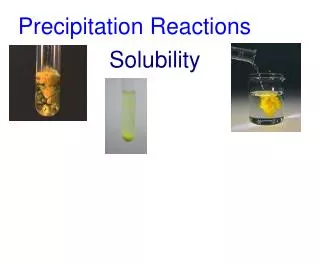
Detection of the end point: Two types of indicators are employed: • The 1st type forms a colored compound with the titrant when it is in excess. • The 2nd type called the adsorption indicator, suddenly becomes adsorbed on the precipitate at the equivalence point.
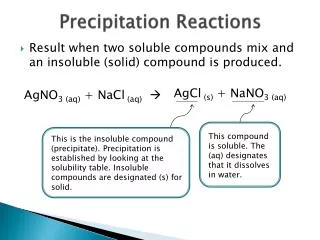
Mohr method: The Cl- is titrated with std. AgNO3 solution. NaCl + AgNO3 AgCl + NaNO3 (white ppt.) A soluble CrO42- salt is added as the indicator. This produces a yellow solution. When the precipitation of Cl- is complete, the first excess of Ag+ reacts with the indicator to precipitate red silver chromate. K2CrO4 + 2AgNO3 Ag2CrO4 + 2KNO3 (yellow sol.) (red ppt.)
Volhard method: It is an indirect titration for determining anions that precipitate with Ag+ (Cl-, Br-, SCN-), and performed in acid solution (HNO3). A measured excess of AgNO3 is added to precipitate the anions, and the excess Ag+ is determined by back-titration with standard SCN- solution. KBr + AgNO3 AgBr + KNO3 + excess Ag+ (Yellow ppt.) Excess Ag+ + SCN- AgSCN (White ppt.)
The end point is detected by adding iron (III) as a ferric alum (ferric ammonium sulfate), which forms a soluble red complex with the first excess of titrant. Fe3+ + SCN- Fe(SCN)2+ (red sol.)
2. Adsorption indicators: The indicator reaction takes place on the surface of the precipitate. The indicator, which is a dye exist in solution as the ionized form, usually an anion, In-. e.g. Fluorescein, Eosin
e.g. titration of Cl- with Ag+ Before eq. point, Cl- is in excess and the 1ry adsorbed layer is Cl-. The 2ry adsorbed layer (counter) is cation. AgCl:Cl- ::Na+ Beyond eq. point, Ag+ is in excess with the 1ry layer being Ag+. This will attract the indicator anion and adsorb it in the counter layer. AgCl:Ag+ ::In-
The color of the adsorbed indicator is different from that of the unadsorbed indicator, and this difference signals the completion of the titration. These indicators are usually weak acids, and if the pH is too low (highly acidic) they will not strongly adsorbed on the ppt. If the indicator is a stronger acid, it can be adsorbed over a wide pH range.
Also, the indicator must not be too strongly adsorbed , or it will displace the anion of the precipitate in the 1ry layer before the eq. point is reached. The degree of adsorption of the indicator can be decreased by increasing the acidity.
SUMMARY • Precipitation reactions titration curves. • Detection of the end point. Thank you