Download
1 / 11
110 likes | 198 Views
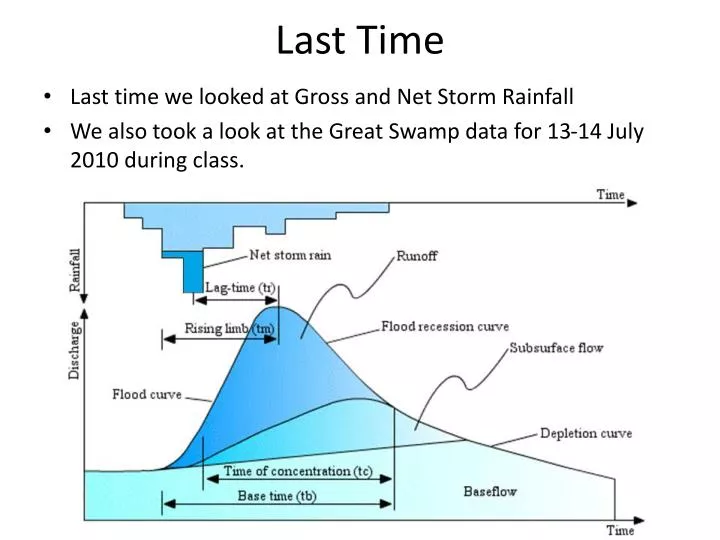
Last Time. Last time we looked at Gross and Net Storm Rainfall We also took a look at the Great Swamp data for 13-14 July 2010 during class. We started with a gross rainfall hyetograph then separated out the infiltration .

E N D
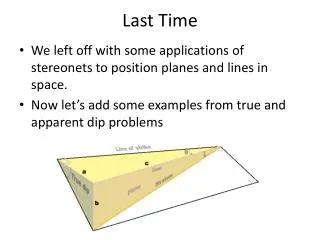
Last Time • Last time we looked at Gross and Net Storm Rainfall • We also took a look at the Great Swamp data for 13-14 July 2010 during class.
We started with a gross rainfall hyetograph then separated out the infiltration If we don’t have a flow gage, then somehow we must generate a hydrograph
Time-Area Routing Methods AKA Clark’s Method > 15 15-10 10-5 <5 Divides area of watershed into subareas with distinct runoff translation times (isochrones) to the outlet.Assumes outflow hydrograph results from uniform velocity flow to the outlet, ignoring any storage.Surface runoff from A1 reaches the outlet first, then A2 An example from Jordan Divide the watershed with lines, each marking a spot where water falling there reaches the outlet gage at 1, 2, 3, etc. hours or days
2. Make a hyetograph with the rain intensity vs. time 1. Make a bar graph with the areas against their arrival times (dyes, mica, m-dots) Gives travel distance 3. Label rain events R1, then R2, then R3, etc.,4. Runoff from storm period R1 on area A2 arrives at the outlet at the same time as rainfall event R2 on A1 Q2= R2A1 + R1A2In general,Qt = RtA1 + Rt-1 A2 + R t-2 A3 + … + R1AjWhere Qt = hydrograph ordinate at time t in cfs Rt = excess rainfall ordinate at time t (ft/sec) and Aj = time-area histogram ordinate at time j (ft2) Notice the number of hyetograph ordinates does not have to equal the number of time-area histogram ordinates
Plot each Discharge Q against time, then connect the dots with a line. A hydrograph is the result.
An Example • As usual, I’ll go through an example in the text, then you will do a similar problem. This method being used for studies around the Great Lakes
Example 2-2A watershed is divided into sections as shown above. Runoff from each section will contribute to flow at Gage G as shown in this table: ___________________________________________________ A B C D _____________________________________________________________________________ Area (acres) 100 200 300 100 Time to gage G (hours) 1 2 3 4 _____________________________________________________________________________ A1 = = A4 LagTimes
The table results in the time-area bar chart above.Consider a rainfall intensity of 0.5 in./hr for 5 hoursQt = RtA1 + Rt-1 A2 + R t-2 A3 + … + R1AjWhere Qt = hydrograph ordinate at time t in cfs Rt = excess rainfall ordinate at time t (ft/sec) and Aj = time-area histogram ordinate at time j (ft2)TODO: derive a bar hydrograph for the storm response at gage G
At 3-4 hours, water from all areas is flowing past the gage.Also, notice the irregular shapes are the same area as the rectangles.
Rain (in/hr) * Area(acres) This method is amenable to spreadsheet use. Here the rain is constant, and the areas don’t change, so each column is identical, lagged by the arrival time.
Rain (in/hr) * Area(acres) = Vol/time • Rain (in/hr) * Area(acres) x 43,560 ft2/ 1 acre • x 1 foot/12 inches x 1 hour/3600 sec • so • 1 inch . acre/hour = 1.008333 ft3/sec ~ 1cfs