Download
1 / 27
270 likes | 360 Views
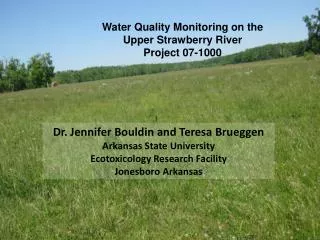
Year Three Review of Water Quality Monitoring on the Upper Strawberry River Project 07-1000. T.R. Brueggen 1 and J.L. Bouldin 1,2 1 Environmental Sciences Graduate Program, Arkansas State University, State University, AR 72467

E N D
Year Three Review of Water Quality Monitoring on the Upper Strawberry River Project 07-1000 T.R. Brueggen1and J.L. Bouldin1,2 1 Environmental Sciences Graduate Program, Arkansas State University, State University, AR 72467 2Department of Biological Sciences, Arkansas State University, State University, AR 72467
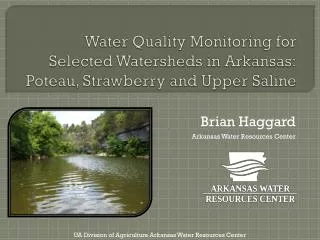
Overview • Major headwater streams in the upper Strawberry River watershed • Little Strawberry (LS) • Sandy Creek (SC) • Greasy Creek (GC) • Above and below BMP implementation • Surface Water Quality Tests • Nutrients • Nitrites • Nitrates • Ortho-Phosphates • Total Suspended Solids http://arkansas-dar.org/strawberryriver.htm
GCUP LSUP GCLO LSLO Greasy Creek (GC) Subwatershed SCUP Little Strawberry (LS) Subwatershed SCLO Sandy Creek (SC) Subwatershed
Sampling sites GCUP Fulton County LSUP GCLO LSLO SCUP Greasy Creek Little Strawberry Sandy Creek SCLO
Little Strawberry (LS) NOX Data Upper Lower
Little Strawberry (LS) Ortho-Phosphate Data Upper Lower
Little Strawberry Total Suspended Solid (TSS) Data Upper Lower
Greasy Creek (GC) NOX Data Upper Lower
Greasy Creek (GC) Ortho-Phosphate Data Upper Lower
Greasy Creek (GC) Total Suspended Solid (TSS) Data Upper 670.0 Lower
Sandy Creek (SC) NOX Data Upper 2011 2011 (Post-BMP) Lower
Sandy Creek (SC) Ortho-Phosphate Data Upper 2011 2011 (Post-BMP) Lower
Sandy Creek (SC) Total Suspended Solid (TSS) Data 179.8 Upper 2011 2011 (Post-BMP) Lower
High and Mean Values: Pre-BMP 2008, 2009, 2010
High and Mean Values: Pre-BMP 2008, 2009, 2010
High and Mean Values: Pre-BMP 2008, 2009, 2010
High and Mean Values: Pre-BMP 2008, 2009, 2010
Other Analyses • Stream bank erosion • Benthic macroinvertebrate survey • Escherichia coli • Supported by 104-B Grant: AWRC and Arkansas State University http://www.esf.edu/rwls/Research/Benthic/ACRONE1-1.jpg http://www.famu.org/mayfly/images/pluteus_nym.jpg http://www.lifeinfreshwater.org.uk/species%20pages/caddis%20flies.jpg.html
Little Strawberry • ≈2.74 stream km (1.7 miles) surveyed • 5,480 m stream bank • 2010 (light blue) • 24 sites determined of severe or very severe erosion • 746 m stream bank • 2011 (purple) • 28 sites determined of severe or very severe erosion • 995 m stream bank
Greasy Creek • ≈3.17 stream km (2.0 miles) surveyed • 6,340 m stream bank • 2010 (green) • 16 sites determined of severe or very severe erosion • 500 m stream bank • 2011 (red) • 16 sites determined of severe or very severe erosion • 575 m stream bank
Sandy Creek • ≈6.63 stream km (4.1 miles) surveyed • 13,260 m stream bank • 2010 (pink) • 22 sites determined of severe or very severe erosion • 505 m stream bank • 2011 (blue) • 21 sites determined of severe or very severe erosion • 525 m stream bank
Benthic Macroinvertebrates Abundance *704 Chironomidae *715 Chironomidae
Escherichia coli * * *No values for June, July, August 2009 *Samples exceeded 298 CFU/100mL maximum for single samples for ERW, ESW, and NSW *Samples exceeded 1490 CFU/100mL max for single sample during the remainder of the year for ERW, ESW, and NSW
Acknowledgments • USEPA 319 Grant • AWRC 104-B USGS Grant • Fulton County Conservation District • Arkansas State University (ASU) Environmental Sciences Graduate Program • All graduate and undergraduate ASU Ecotoxicology Research Facility Workers