Download
1 / 38
380 likes | 459 Views
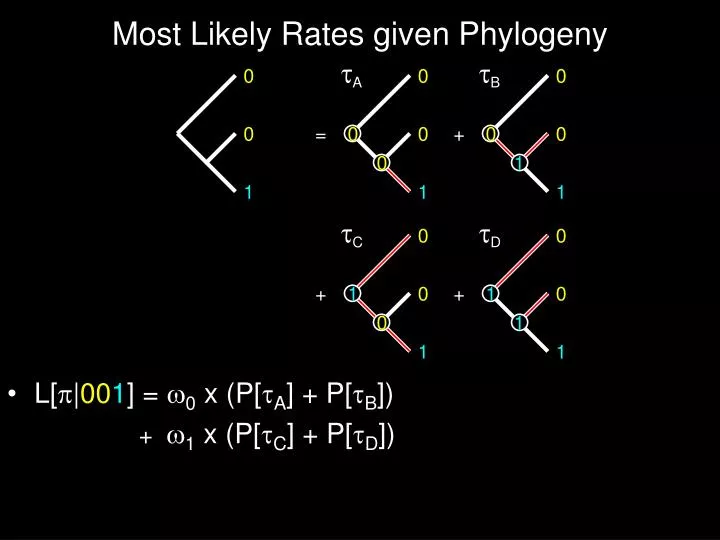
Most Likely Rates given Phylogeny. L[ | 00 1 ] = 0 x (P[ A ] + P[ B ]) + 1 x (P[ C ] + P[ D ]). Most Likely Rates given Phylogeny. If 0 = 1 : L[ | 00 1 ] ∝ P[ 00 1 | , A ] + P[ 00 1 | , B ]

E N D
Most Likely Rates given Phylogeny • L[|001] = 0 x (P[A] + P[B]) + 1 x (P[C] + P[D])
Most Likely Rates given Phylogeny • If 0 = 1: L[|001] ∝ P[001|,A] + P[001|,B] + P[001|,C] + P[001|,D]
Most Likely Rates given Phylogeny P[001|,A] = (1-)3 x 1 P[001|,B] = (1-)2 x 2 P[001|,C] = (1-)1 x 3 P[001|,D] = (1-)2 x 2
Most Likely Rates given Phylogeny • If 0 = 1: L[|001] ∝ -2
Most Likely Rates given Phylogeny • If 0 = 1: L[|001] ∝ -2 dL[|001] ∝ -2 ∴ L[|001] maximized at 2 =
Allowing uncertain ancestry favors high rates P[001|,] = - 2 i.e., probability maximized when character changes half of the time!
Matrices have obvious structure (25 steps over 16 taxa & 20 characters)….. • 00000000000000000000 • 00000110000000010100 • 00001111000000010100 • 00001101010000010100 • 00101101010000010100 • 01101101111000010100 • 11101101111000001100 • 11101101111010000100 • 11101101111000001100 • 11101101111010000110 • 11101101111110000110 • 11101101111111100110 • 11101101111111100111 • 11111001111000001100 • 11111001111000001100 • 11111001110000011100
….. or lack thereof (50 steps over 16 taxa & 20 characters) • 00000000000000000000 • 00010000000000001100 • 00010001000101011100 • 00000000000001101000 • 00111011000101011100 • 00011110101001101001 • 01011000000101010000 • 01011000100101011000 • 01111001000111011000 • 01111001000001010000 • 01001010111001101111 • 01001010111001101111 • 10001010110000101111 • 10011010110001101111 • 11011011110001101101 • 10001010110000101111
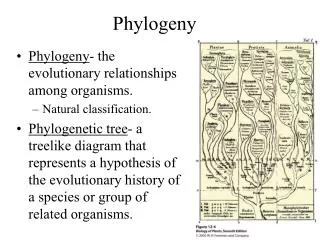
Evaluating Matrix Structure:Do the distributions of character states tell us anything prior to phylogenetic analysis?
Character Compatibility • Compatible character pairs: two characters with state combinations that do not necessarily imply homoplasy • Incompatible character pairs: two characters with state combinations that do necessarily imply homoplasy.
Compatible: no homoplasy on some trees A B 0 0 1 0 1 1 Incompatible: homoplasy on all trees A B 0 0 1 0 1 1 0 1 Compatibility among binary characters
Graphical depiction of (in)compatibility:closing the circuit is “bad”
D E D E D E D E 0 0 0 0 0 0 1 0 = 1 0 1 0 1 1 1 1 1 1 2 0 2 0 2 0 2 2 2 2 2 0 Compatible: all “pairs” must be compatible AND each pair must have unique combinations. Compatibility among unordered multistates: break characters down into binaries
D F D F D F D F 0 0 0 0 0 0 0 2 0 2 0 2 1 0 = 1 0 1 0 1 1 1 1 1 1 2 0 2 0 2 0 2 2 2 2 2 0 Incompatible: states 0 and 2 show all combinations. Compatibility among unordered multistates: only one “pair” need be incompatible
D G D G D G D G 0 0 0 0 0 0 0 1 0 1 0 1 1 0 = 1 0 1 0 1 2 1 2 1 2 2 1 2 1 2 1 2 2 2 2 2 2 Incompatible: all pairs compatible, but you cannot have the third pair and the first two without homoplasy. Compatibility among unordered multistates: sometimes incompatibility is subtle.
H I H J 0 0 0 0 1 0 1 0 1 1 1 1 2 1 2 0 2 2 2 2 HI show no gap in distributions (compatible); Compatibility among Ordered multistates: Order of states must not be broken
H I H J 0 0 0 0 1 0 1 0 1 1 1 1 2 1 2 0 2 2 2 2 HJ show a gap in distributions (incompatible). Compatibility among Ordered multistates: Order of states must not be broken
Inferring Phylogeny with Compatibility: Clique Analysis • Clique: a group of characters that all are compatible; • Take the largest clique and infer phylogeny from those characters • This can produce a general (usually polytomous) tree with no homoplasy; • Within each section of the phylogeny, find the largest remaining clique; • Use this to clarify relations among those taxa; • Rinse & repeat…. • Note: “That was them, not us…..” (G. Estabrook, a.k.a., “Mr. Compatibilty”
Testing Matrix Structure with Compatibility: Permutation Tests • Calculate number of compatible pairs in matrix. • Permute matrix, scrambling states within each character; • Each character retains same number of taxa with each state; • Estimates P[observed compatibility] given such high rates of change that there is no inheritance. • Calculate compatibility of matrix & characters; • If observed compatibility is within the range of permuted matrix, then the data likely are cr@p; • If an individual character’s compatibility is with the range of a permuted character, then it is likely useless.
Testing Matrix Structure with Compatibility: Simple Inverse Models • Calculate number of compatible pairs in matrix. • Evolve a tree and matrix of the same dimensions as the original data; • Use same number of states as seen for each character; • Estimates P[observed compatibility] given particular frequencies of change. • Calculate compatibility of matrix & characters; • Tally P[compatibility | overall changes] for matrix or matrix partitions; • Tally P[compatibility | # changes, # derived taxa] for each character.
Probability of CompatibilityGiven Total Number of Steps • As frequencies of change (and thus homoplasy) increase, the expected matrix compatibility drops.
One can test partitions for significant differences in frequencies of change • “Slug” characters are significantly less homoplastic than are shell characters among the Rapaninae.
One can test partitions for significant differences in frequencies of change • This is much less true for species in the Nassariidae.
Effect of Change on Compatibility Simulation of 32 taxa with 100 binary characters and 200 total changes • Infrequently changing characters typically have high compatibilities • frequently changing ones have low compatibilities.
Extreme distributions of taxa with derived states:End cases automatically compatible 000 001 001 001 001 001 001 001 011 011 011 011 011 011 011 111
Effect of Derived Taxa on Compatibility Simulation of 32 taxa with 100 binary characters and 200 total changes • Characters with 1 or 31 taxa with 0 or 1 (= autapomorphic) are automatically compatible • Characters with 16 0’s and 1’s have lowest compatibility.
1 Change Given X steps, compatibility is correlated with the number of derived taxa. 3 Changes 2 Changes
Effect of Correlated Character Changeon Compatibility • Simulated case with two suites of characters in which change in one induces a 75% chance of change in others. • Elevates compatibility because distributions are so similar.
Testing for Independent Character Change: Mutual Compatibility • Mutual compatibility: common compatibilities between two characters. • If character i and j both are compatible with character k, then it is a mutual compatibility. • Character suites that exhibit correlated change should share more mutual compatibilities than independently changing characters. • Do characters i & j have more mutual compatibilities than expected given compatibility and independent change?
Testing for Independent Character Change: Mutual Compatibility • Multivariate structure among mutual compatibilities clusters correlated suites. • Similarity between each character pair based on proportion of other characters with which both are compatible.
Testing for Independent Character Change: Mutual Compatibility • Mutual compatibility: common compatibilities between two characters. • If character i and j both are compatible with character k, then it is a mutual compatibility. • Character suites that exhibit correlated change should share more mutual compatibilities than independently changing characters. • Do characters i & j have more mutual compatibilities than expected given compatibility and independent change?
Stratigraphic Compatibility • For individual characters: no states with gaps in sampled record • For character pairs: compatible pair in which the appearance of character pairs is also consistent with phylogeny.
Compatible Pair Compatible with Stratigraphy Ch 1 Ch2 FA LA 0 0 1 8 1 0 2 4 1 1 2 6 2 0 6 8 2 2 7 7 No necessary homoplasy, nor any necessary stratigraphic gaps between morphotypes.
Compatible Pair Incompatible with Stratigraphy Ch 1 Ch2 FA LA 0 0 5 8 0 1 3 8 1 0 2 6 1 2 1 4 Morphotypes 00 and 01 appear out of order given character necessary to avoid homoplasy.
Compatible Pair Incompatible with Stratigraphy Ch 1 Ch2 FA LA 0 0 1 8 1 1 2 7 2 1 2 4 2 2 6 8 Morphotypes appear in the right order, but a gap exists between morphotypes 21 & 22.
Compatible Pair Incompatible with Stratigraphy Ch 1 Ch2 FA LA 0 0 1 8 1 1 2 7 1 1 3 6 Morphotypes appear in the right order, but a gap exists within morphotypes 01.