Download
1 / 15
150 likes | 240 Views
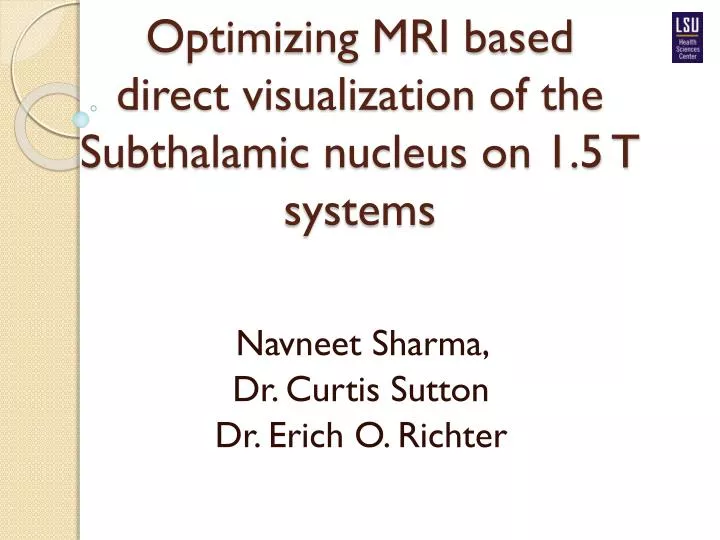
Optimizing MRI based direct visualization of the Subthalamic nucleus on 1.5 T systems. Navneet Sharma, Dr. Curtis Sutton Dr. Erich O. Richter. Objectives. Determine protocol parameters that enhance visualization of the Subthalamic nucleus (STN) using MRI (1.5T)

E N D
Optimizing MRI based direct visualization of the Subthalamic nucleus on 1.5 T systems Navneet Sharma, Dr. Curtis Sutton Dr. Erich O. Richter
Objectives • Determine protocol parameters that enhance visualization of the Subthalamic nucleus (STN) using MRI (1.5T) • Check if these parameters need to be changed or not for each individual • Compare and contrast the parameter values between normal and Parkinson's patients
Complications • Currently the MRI techniques using the 1.5 T magnet only gives a vague outline of the STN’s location • localized during the procedure using microelectrode recording RICHTER, et al. Determining the position and size of the subthalamic nucleus based on magnetic resonance imaging results in patients with advanced Parkinson disease. J Neurosurg 100:541–546, 2004
Methods • T1 volumetric and T2 weighted MRIs were taken from 3 different volunteers • Controlled various variables to assess quality of the images • Time Echo (TE) • Time Repetition (TR) • Bandwidth • Slice Thickness • 3D reconstructions of the STN were generated using BrainLAB 2.6 software • Subsequently, the parameters from the normal MRI scans was compared to those of Parkinson’s patients
Results These values help differentiate Fe containing structures from non-Fe containing structures in the Basal Ganglia *switch to in-patient procedure to accommodate the increased scan time
The reduced TE associated with PD is indicative of increased free iron levels in PD compared to normal • This leads to highly neurotoxic states which cause neurodengeneration in the STN Based on literature review, the pars compacta of the SN shows significant increase in free iron accumulation compared to the STN associated with PD. We observed the opposite to be true in our normal controls. Wypijewska, et al Iron and reactive oxygen species activity in parkinsonian substantia nigra Parkinsonism Relat Disord. 2010 Jun;16(5):329-33. Epub 2010 Mar 9.
TE = 153 TE = 108 TE = 126 TE = 144
TR = 3000 TR =5000 TR = 6000 TR = 8000
BW = 31.25 BW = 62.50 BW = 100.00 BW = 166.67
Conclusion • Optimizing the right parameters can help directly visualize the subthalamic and surrounding nuclei with a 1.5T MRI • These parameters work equally well for different individuals in normal individuals • Further improvements in treatment of PD patients can be achieved through a combinatorial imaging approach • Addition of DT images to delineate the white matter shell around the STN • T1 based grey-white matter differentiation Future Direction