Download
1 / 57
580 likes | 735 Views
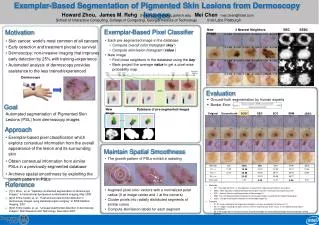
Spatially Constrained Segmentation of Dermoscopy Images. Howard Zhou 1 , Mei Chen 2 , Le Zou 2 , Richard Gass 2 , Laura Ferris 3 , Laura Drogowski 3 , James M. Rehg 1. 1 School of Interactive Computing, Georgia Tech 2 Intel Research Pittsburgh

E N D
Spatially Constrained Segmentation of Dermoscopy Images Howard Zhou1, Mei Chen2, Le Zou2, Richard Gass2, Laura Ferris3, Laura Drogowski3, James M. Rehg1 • 1School of Interactive Computing, Georgia Tech • 2Intel Research Pittsburgh • 3Department of Dermatology, University of Pittsburgh
Skin cancer and melanoma • Skin cancer : most common of all cancers [ Image courtesy of “An Atlas of Surface Microscopy of Pigmented Skin Lesions: Dermoscopy” ]
Skin cancer and melanoma • Skin cancer : most common of all cancers • Melanoma : leading cause of mortality (75%) [ Image courtesy of “An Atlas of Surface Microscopy of Pigmented Skin Lesions: Dermoscopy” ]
Skin cancer and melanoma • Skin cancer : most common of all cancers • Melanoma : leading cause of mortality (75%) • Early detection significantly reduces mortality [ Image courtesy of “An Atlas of Surface Microscopy of Pigmented Skin Lesions: Dermoscopy” ]
Clinical View Dermoscopy view [ Image courtesy of “An Atlas of Surface Microscopy of Pigmented Skin Lesions: Dermoscopy” ]
Dermoscopy view Clinical view Dermoscopy • Improve diagnostic accuracy by 30% in the hands of trained physicians • May require as much as 5 year experience to have the necessary training • Motivation for Computer-aided diagnosis (CAD) in this area
First step of analysis:Segmentation • Separatinglesions from surrounding skin • Resulting border • Gives lesion size and border irregularity • Crucial to the extraction of dermoscopic features for diagnosis • Previous Work : • PDE approach – Erkol et al. 2005, … • Histogram thresholding – Hintz-Madsen et al. 2001, … • Clustering – Schmid 1999, Melli et al. 2006… • Statistical region merging – Celebi et al. 2007, …
Domain specific constraints • Spatial constraints • Four corners are skin (Melli et al.2006, Celebi et al. 2007) • Implicitly enforcing Local neighborhood constraints on image Cartesian coordinates (Meanshift)
Meanshift (c = 32, s = 8) Domain specific constraints • Spatial constraints • Four corners are skin (Melli et al.2006, Celebi et al. 2007) • Implicitly enforcing Local neighborhood constraints on image Cartesian coordinates (Meanshift)
Meanshift (c = 32, s = 8) We explore … • Spatial constraints arise from thegrowth pattern of pigmented skin lesions
Meanshift (c = 32, s = 8) We explore … • Spatial constraints arise from thegrowth pattern of pigmented skin lesions – radiating pattern
Meanshift (c = 32, s = 8) Embedding constraints • Radiating pattern from lesion growth • Embedding constraints as polar coords improves segmentation performance Polar (k = 6)
Embedding constraints • Radiating pattern from lesion growth • Embedding constraints as polar coords improves segmentation performance Meanshift Polar Polar (k = 6)
White: Dr. Ferris Red : Dr. Zhang Blue : computer Comparison to the Doctors • Radiating pattern from lesion growth • Embedding constraints as polar coords improves segmentation performance Meanshift Polar
Growth pattern of pigmented skin lesions • lesions grow in both radial and vertical direction • Skin absorbs and scatters light. • Appearance of pigmented cells varies with depth • Dark brown tan blue-gray • Common radiating appearance pattern on skin surface [ Image courtesy of “Dermoscopy : An Atlas of Surface Microscopy of Pigmented Skin Lesions]
Radiating growth pattern on skin surface • Difference in appearance: more significant along the radial direction than any other direction.
Radiating growth pattern on skin surface • Difference in appearance: more significant along the radial direction than any other direction.
original r {R, G, B} Embedding spatial constraintsFeature vectors • Each pixel feature vector in R4 • 3D: R,G,B or L, a, b in the color space • 1D: polar radius measured from the center of the image (normalized by w)
original filtered r {R, G, B} Embedding spatial constraintsGrouping features • Each pixel feature vector in R4 • Clustering pixels in the feature space • Replace pixels with mean for compact representation
… … Radiating pattern Dermoscopy vs. natural images Derm dataset (216) BSD dataset (300)
Cartesian {Rc, Gc, Bc} original polar {Ro, Go, Bo} {Rp, Gp, Bp} Embedding spatial constraintsGrouping features • Mean per-pixel residue: average per-pixel color difference of each pair
Residue (Cartesian) Residue (Cartesian) Residue (polar) Residue (polar) BSD dataset (300) Derm dataset (216) Dermoscopy vs. natural images Polar vs. Cartesion • Mean per-pixel residue (k-means++, k = 30)
Dermoscopy vs. natural images Polar vs. Cartesion • Mean per-pixel residue (k-means++, k = 30)
Polar vs. Cartesian • The regions appear more blocky in the Cartesian case Polar (k = 30) Cartesian (k = 30)
Six super-regions • 30 clusters 6 super clusters (K-means++) Polar (k = 6) Cartesian (k = 6)
Final segmentation Polar Cartesian
Polar vs. Meanshift • The regions appear more blocky in the Meanshift case Polar (k = 6) Meanshift (c = 32, s = 8)
Final segmentation Polar Meanshift
Algorithm overview • Given a dermoscopy image
original Algorithm overview • Given a dermoscopy image
original 30 clusters Algorithm overview 1. First round clustering: K-means++ (k = 30)
original 30 clusters 6 Super-regions Algorithm overview 2. Second round: clusters(30) super-regions(6)
original 30 clusters 6 Super-regions Texture edge map Algorithm overview 3. Apply texture gradient filter (Martin, et al. 2004)
original 30 clusters 6 Super-regions Final segmentation Texture edge map Algorithm overview 4. Find optimal boundary (color+texture)
original 1. First round clustering • First round clustering: K-means++ (k = 30) • Reduce noise • Groups pixels into homogenous regions – a more compact representation of the image • Artuhur and Vassilvitskii, 2007 • R4 : {L*a*b* (3D), w * polar radius (1D)}
original 30 clusters 1. First round clustering • First round clustering: K-means++ (k = 30) • Reduce noise • Groups pixels into homogenous regions – a more compact representation of the image • Artuhur and Vassilvitskii, 2007 • R4 : {L*a*b* (3D), w * polar radius (1D)}
original 30 clusters 2. Second round clustering • K = 6 : clusters(30) super-regions(6) • Account for intra-skin and intra-lesion variations • Avoid a large k • Super-regions correspond to meaningful regions such as skin, skin-lesion transition, and inner lesion, etc.
original 30 clusters 6 super-regions 2. Second round clustering • K = 6 : clusters(30) super-regions(6) • Account for intra-skin and intra-lesion variations • Avoid a large k • Super-regions correspond to meaningful regions such as skin, skin-lesion transition, and inner lesion, etc.
original 3. Color-texture integration • Incorporating texture information can improve segmentation performance. • Severely sun damaged skin; texture variations at boundaries in addition to color variations
original 3. Color-texture integration • Incorporating texture information can improve segmentation performance. • Severely sun damaged skin; texture variations at boundaries in addition to color variations • Apply texture gradient filter(Martin, et al. 2004)
original Texture edge map 3. Color-texture integration • Incorporating texture information can improve segmentation performance. • Severely sun damaged skin; texture variations at boundaries in addition to color variations • Apply texture gradient filter(Martin, et al. 2004) • Texture edge map: pseudo-likelihood
6 super-regions 4. Optimal boundary • Optimal skin-lesion boundary • Color: Earth Mover’sDistance (EMD) between every pair of super-regions
Texture edge map 6 super-regions 4. Optimal boundary • Optimal skin-lesion boundary • Color: Earth Mover’sDistance (EMD) between every pair of super-regions • Texture: Texture edge map
Texture edge map 6 super-regions 4. Optimal boundary • Optimal skin-lesion boundary • Color: Earth Mover’sDistance (EMD) between every pair of super-regions • Texture: Texture edge map • Minimizing theintegrated color-texture measure
Validation and results • Our collaborating dermatologist Dr. Ferris manually outline thelesions in 67 dermoscopy images • The border error is givenby • Computer: binary image obtained by filling the automaticdetected border • ground-truth: obtained by fillingin the boundaries outlined by Dr. Ferris
White: Dr. Ferris Red : Dr. Zhang Blue : computer Error = 12.96% Typical segmentation result
Comparison To account for inter-operator variation, we also asked Dr. Alex Zhang to manually outline boundaries on the same dataset
White: Dr. Ferris Red : Dr. Zhang Blue : computer Additional results Error = 5.80%
White: Dr. Ferris Red : Dr. Zhang Blue : computer Additional results Error = 13.61%