Download
1 / 9
110 likes | 518 Views
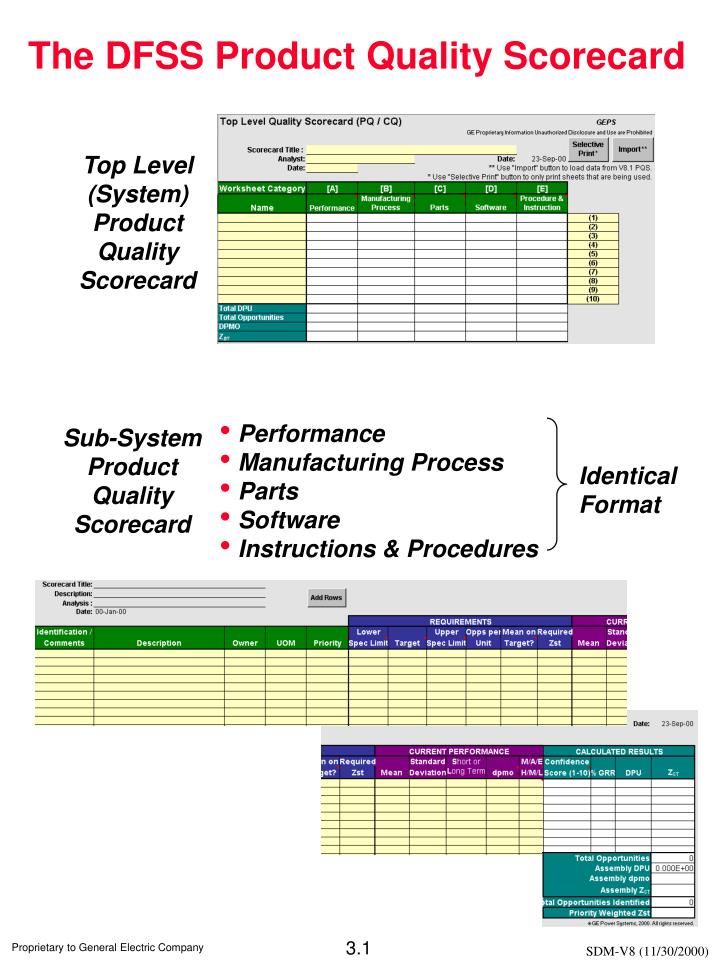
The DFSS Product Quality Scorecard. Top Level (System) Product Quality Scorecard. Sub-System Product Quality Scorecard. Performance Manufacturing Process Parts Software Instructions & Procedures. Identical Format. Example of a Functional Block Diagram.

E N D
The DFSS Product Quality Scorecard Top Level (System) Product Quality Scorecard Sub-System Product Quality Scorecard • Performance • Manufacturing Process • Parts • Software • Instructions & Procedures Identical Format
Example of a Functional Block Diagram Temperature & Pressure Readout Air Pressure Relief Automatic Shutdown Pressure & Temperature Instrument & Monitors 20 Sensor Output Signals (Temp. & Oil Pressure) High Pressure Air Electric Power Torque Motor Compressor Electrical Control 10 50 440V (3510 RPM) Cooled & Dried Moisture Separation 30 Air Salt to Fresh Cooled Oil Water Exchange Fresh Water Oil Lubrication 40 Functional Specs. GE Proprietary Information Unauthorized Disclosure and Use are Prohibited How to Establish Product Quality Scorecard Structure Performance Capability Scorecard
Distance Pieces Turbine Wheels Compressor Wheels Turbine Bolts Spacer Wheels Compressor Blades Stub Shafts Compressor Bolts Spacers Buckets GE Proprietary Information Unauthorized Disclosure and Use are Prohibited How to Establish Product Quality Scorecard Structure Customer Sites System Level Example of Product Tree Gas Turbine Final-Assembly Level • Sub-System Level CTQs • (Related to Compressor Rotor) • Measured during Compressor Rotor Assembly • Blade Tip Diameter Rotor Sub-Assembly Level Turbine Rotor Compressor Rotor Sub-Assembly Level • Component Level CTQs (Related to Bucket) • Measured during Bucket Manufacturing • Trailing Edge Thickness - Tip/Root • Roundness Fwd/Aft End - CCC/CDC • Vane Thickness - Tip/Root • Surface Finish - Airfoil • Vane Length (Stator) Component Manufacturing Level Use Sub-System scorecard worksheet to build Process and Parts Capability Scorecards
Sample Product Quality Scorecard Information What Examples can you think of ?
The Sub-System Capability Scorecard CTQ Description • CTQ ID, description & ownership. • UOM: Unite of measurement. • Priority: Use to describe relative priority level of each CTQ. CTQ Requirements • Currently specified upper and lower spec limits (can be one-sided - only one entry.) Use “*” if no spec limit to be used. • Target, an optional input used to judge the centering of the parameter. • Opps per Unit: Opportunity per unit. • Mean on Target: a manual input by user. • Required Zst. CTQ Performance Data Inputs • Predicted mean and std dev for parameter. Derived from transfer function or experimentation. • Is data Short term or Long term (default is Long term.) • Enter dpmo if data is discrete. • Enter the source and confidence of data reported. M/A/E:Measured/Analyzed/Estimated • H/M/L:High/Medium/Low Confidence CTQ Performance Results • Confidence Score: The score is based on the combined effect of source and confidence level of mean and std dev. Used to gauge the confidence of reported results - tracking only. • Results of Gage R&R study. Tracking only - not used in any calculations. • Attribute Data: = Attribute DPU • Continuous Data: = % area under long term distribution outside the spec limit(s). (sLT = 1.3sST) • ZST = Short term “sigma” (shift = 1.5) corresponding to the parameter DPU on a one-tailed distribution. Total Opportunities = sum of all Opportunities (involved in Zst calculation) Assembly DPU = sum of all DPU’s Assembly dpmo = (Assembly DPU/Total Opportunities) x 106 Assembly ZST= Short term “sigma” (shift = 1.5) corresponding to the above dpmo on a one-tailed distribution. Total Opportunities Identified = sum of all Opportunities identified regardless of whether a corresponding Zst is calculated or not Priority Weighted ZST = Short term “sigma” (shift = 1.5) corresponding to the dpmo weighted by the priority levels.
The Priority Weighted Zst CTQ Description CTQ Performance Results • Priority allows different weighting factors to be assigned for CTQs so to reflect the relative ranking of importance. • If CTQ1 priority=2 • CTQ2 priority=5 • then results • CTQ1 Defect/Opportunityx2/7 • CTQ2 Defect/Opportunityx5/7 • Priority weighted Zst is calculated based on the weighted dpmo
The Confidence Score • Provided a confidence gauge on mean and std dev used to calculate performance. • Calculated based on the source of data (Measure/Analyzed/Estimated) and confidence level of the data (High/Medium/Low.) • Not involved in calculation of Zst, only a gauge for tracking.
The Top Level (System) Product Quality Scorecard DPU Totals from Sub-System Scorecards Short term column “sigma” (shift = 1.5) corresponding to dpo=Total DPU/Total Opportunities Column Totals
Product Quality Scorecard Excel Spreadsheet • Enter data from the generic example onto the Product Quality scorecard • Enter data from a business specific example onto a Product Quality Scorecard • Modify the data of an entry point on the Product Quality Scorecard entering both discrete and continuous data, and process the changes to the Product Quality Scorecard outputs • Modify a short term / long term data entry for both discrete and continuous data, and process changes to the Product Quality Scorecard Software Demonstration