Download
1 / 46
460 likes | 552 Views
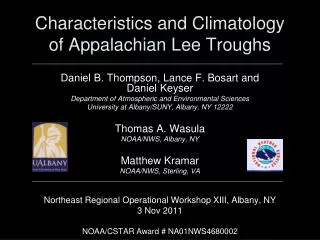
Appalachian Lee Troughs and their Association with Severe Thunderstorms. Daniel B. Thompson, Lance F. Bosart and Daniel Keyser Department of Atmospheric and Environmental Sciences University at Albany/SUNY, Albany, NY 12222 Thomas A. Wasula NOAA/NWS, Albany, NY Matthew Kramar

E N D
Appalachian Lee Troughsand their Association with Severe Thunderstorms Daniel B. Thompson, Lance F. Bosart and Daniel Keyser Department of Atmospheric and Environmental Sciences University at Albany/SUNY, Albany, NY 12222 Thomas A. Wasula NOAA/NWS, Albany, NY Matthew Kramar NOAA/NWS, Sterling, VA 46th CMOS Congress 25th AMS Conference on Weather Analysis and Forecasting 1 June 2012 NOAA/CSTAR Award # NA01NWS4680002
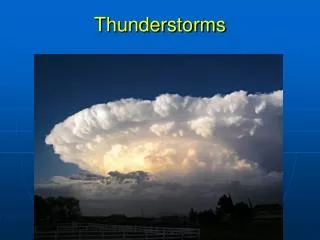
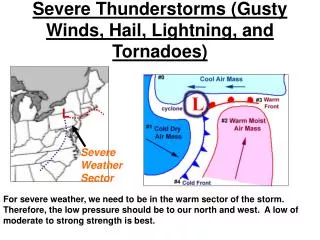
Motivation • Region of study: Mid-Atlantic U.S. • Accurate forecasts of location, mode and severity of thunderstorms are important, due to proximity of Eastern Seaboard • Region is often characterized by weak forcing and ample instability during warm season • Mesoscale boundaries important • Sea breeze boundary • Outflow boundaries • Lee trough
Outline • Climatology of Appalachian lee troughs (ALTs) • Categorization scheme for ALTs • Spatial frequency of storm reports by ALT category • Summary of key points
Outline • Climatology of Appalachian lee troughs (ALTs) • Categorization scheme for ALTs • Spatial frequency of storm reports by ALT category • Summary of key points
Data and Methodology – Climatology • Analyzed 13 cases of ALT events associated with warm-season severe convection • Sterling, VA (LWX), CWA • 0.5° CFSR (Climate Forecast System Reanalysis) • Identified common features and used them as criteria to construct a climatology • May–September, 2000–2009
ALTs – Common Low-Level Features MSLP (black, hPa), 1000–850-hPa thickness (fills, dam), 10-m winds (barbs, kt) 1800 UTC Composite (N=13)
ALTs – Common Low-Level Features MSLP (black, hPa), 1000–850-hPa thickness (fills, dam), 10-m winds (barbs, kt) 1800 UTC Composite (N=13)
ALTs – Common Low-Level Features Winds orthogonal to mountains MSLP (black, hPa), 1000–850-hPa thickness (fills, dam), 10-m winds (barbs, kt) 1800 UTC Composite (N=13)
ALTs – Common Low-Level Features Thermal ridge Winds orthogonal to mountains MSLP (black, hPa), 1000–850-hPa thickness (fills, dam), 10-m winds (barbs, kt) 1800 UTC Composite (N=13)
Domain for Climatology WIND ZONE ALT ZONE DOMAIN
Methodology for Climatology • Climatology was based on the following three criteria: • 925-hPa Wind Direction • Checked for wind component directions orthogonal to and downslope of Appalachians • Appalachians in the Mid-Atlantic are oriented ~ 43° right of true north • Satisfactory meteorological wind directions exist between 223° and 43° WIND ZONE ALT ZONE • Criterion: wind direction computed from zonal average of wind components along each 0.5° of latitude within Wind Zone must be between 223° and 43° DOMAIN
Methodology for Climatology • Climatology was based on the following three criteria: • MSLP Anomaly • Averaged MSLP along each 0.5° of latitude within domain • Checked for minimum MSLP along each 0.5° of latitude within ALT Zone WIND ZONE ALT ZONE • Criterion: difference of minimum and zonal average MSLP must be less than −0.75 hPa DOMAIN
Methodology for Climatology • Climatology was based on the following three criteria: • 1000–850-hPa layer-mean temperature anomaly • Averaged 1000–850-hPa layer-mean temperature along each 0.5° of latitude within domain • Checked for maximum 1000–850-hPa layer-mean temperature along each 0.5° of latitude within ALT Zone WIND ZONE ALT ZONE • Criterion: difference of maximum and zonal average 1000–850-hPa layer-mean temperature must be greater than 1°C DOMAIN
Methodology for Climatology • The three criteria must be met for six consecutive 0.5° latitudes • An algorithm incorporating the three criteria was run for the length of the climatology at 6-h intervals (0000, 0600, 1200 and 1800 UTC) • ALTs identified by this algorithm were manually checked for false alarms (e.g., frontal troughs, cyclones, large zonal pressure gradients)
Climatology – Results • ALT recorded 26.6% of the time throughout the climatology MSLP anomaly < −0.75 hPaTemperature anomaly > 1°C
Climatology – Results • ALT recorded 26.6% of the time throughout the climatology MSLP anomaly < −0.75 hPaTemperature anomaly > 1°C • Over 75% of ALTs occur in June, July and August • Nearly 66% of ALTs occur at 1800 or 0000 UTC • The seasonal and diurnal heating cycles likely play a role in ALT formation
Outline • Climatology of Appalachian lee troughs (ALTs) • Categorization scheme for ALTs • Spatial frequency of storm reports by ALT category • Summary of key points
ALT Categories • ALTs can be grouped into four categories based on their relationship with synoptic-scale cold fronts • ALTs that occur in advance of cold fronts can be considered prefrontal troughs (PFTs) • Categories: • Inverted • No PFT: Non-prefrontal • PFT, partial FROPA: Prefrontal without frontal passage through entire ALT Zone • PFT, total FROPA: Prefrontal with frontal passage through entire ALT Zone
ALT Categories – Examples • Inverted – trough extends northward from south of the ALT Zone 0000 UTC 31 May 2001 MSLP (black, hPa) and 1000–850-hPa thickness (fills, dam)
ALT Categories – Examples • No PFT – trough occurs in the absence of a synoptic cold front 0000 UTC 10 July 2000 MSLP (black, hPa) and 1000–850-hPa thickness (fills, dam)
ALT Categories – Examples • PFT, partial FROPA • Front must be south of the NY/PA border or east of the western third of PA • Front does not pass through entire ALT Zone 0000 UTC 3 June 2000 MSLP (black, hPa) and 1000–850-hPa thickness (fills, dam)
ALT Categories – Examples • PFT, total FROPA • Front must be south of the NY/PA border or east of the western third of PA • Front passes through entire ALT Zone within 24 h 1800 UTC 13 May 2000 MSLP (black, hPa) and 1000–850-hPa thickness (fills, dam)
ALT Categories – Relative Frequency • Category 2 (No PFT) occurs most frequently
ALT Categories – Relative Frequency • Category 2 (No PFT) occurs most frequently • PFTs account for 44.8% of ALTs
ALT Categories – Monthly Distribution • Category 2 and 3 are more common in JJA, while category 4 is more common in May and September • Stronger westerlies, more FROPA during “transition months”
Outline • Climatology of Appalachian lee troughs (ALTs) • Categorization scheme for ALTs • Spatial frequency of storm reports by ALT category • Summary of key points
Spatial Frequency of Storm Reports by Category – Methodology • Severe local storm reports were obtained from the NCDC Storm Data publication • Included all tornado, severe thunderstorm wind and severe hail (> 1in) for May–September, 2000–2009 ALT ZONE
Spatial Frequency of Storm Reports by Category – Methodology • “Clustering” – attempt to control for population bias in Storm Data • Overlay a 0.5° by 0.5° grid box over the domain • If a storm report occurs within a certain grid box, that grid box is considered “active” • Any subsequent storm reports occurring within the active box are discarded within a 6-h period • The number of active grid boxes for each 6-h period are tallied to measure the spatial extent of severe weather • 6-h periods begin at 0000, 0600, 1200, and 1800 UTC
Spatial Frequency of Storm Reports by Category Percentage of 6-h periods with at least one active grid box Category 3 (PFT, partial FROPA; N=599) Category 2 (No PFT; N=827)
Spatial Frequency of Storm Reports by Category Percentage of 6-h periods with at least one active grid box Category 3 (PFT, partial FROPA; N=599) Category 2 (No PFT; N=827) • Distribution within ALT Zone is similar
Spatial Frequency of Storm Reports by Category Percentage of 6-h periods with at least one active grid box Category 3 (PFT, partial FROPA; N=599) Category 2 (No PFT; N=827) • Distribution within ALT Zone is similar • Difference lies in areas NW of ALT Zone
Spatial Frequency of Storm Reports by Category Percentage of 6-h periods with at least one active grid box Category 4 (PFT, total FROPA; N=130) Category 1 (Inverted; N=73)
Spatial Frequency of Storm Reports by Category Percentage of 6-h periods with at least one active grid box Category 4 (PFT, total FROPA; N=130) Category 1 (Inverted; N=73) • South half of ALT Zone favored in Category 1
Spatial Frequency of Storm Reports by Category Percentage of 6-h periods with at least one active grid box Category 4 (PFT, total FROPA; N=130) Category 1 (Inverted; N=73) • South half of ALT Zone favored in Category 1 • Proportionally more storm reports near the coast in Category 4 than 2 or 3
Spatial Frequency of Storm Reports by Category Percentage of 6-h periods with at least one active grid box Category 4 (PFT, total FROPA; N=130) Category 1 (Inverted; N=73) • South half of ALT Zone favored in Category 1 • Proportionally more storm reports near the coast in Category 4 than 2 or 3 • Maximum in Category 4 from DCA–PHL
Category 4: PFT, Total FROPA Cat 4 (N=130) Percentage of 6-h periods with at least one active grid box
Category 4: PFT, Total FROPA Cat 4 (N=130) • Plume of high CAPE is collocated with 30–35 kt of shear in northern ALT Zone • Collocation of high CAPE and shear values suggest that category 4 severe events may favor the DCA–PHL corridor Cat 4 (N=17) Percentage of 6-h periods with at least one active grid box Composite of 17 days with most active grid boxes Surface to 500-hPa bulk shear (black, kt), MUCAPE (fills, J/kg)
Category 3 and Category 4 Comparison • Higher shear in category 4 severe composites suggest severe events are more organized Cat 3 (N=17) Cat 4 (N=17) Composite of 17 days with most active grid boxes Surface to 500-hPa bulk shear (black, kt), MUCAPE (fills, J/kg)
Outline • Climatology of Appalachian lee troughs (ALTs) • Categorization scheme for ALTs • Spatial frequency of storm reports by ALT category • Summary of key points
Summary – Key Points • ALTs form preferentially during diurnal and seasonal heating maxima
Summary – Key Points • ALTs form preferentially during diurnal and seasonal heating maxima • Frequency of each ALT category varies by month • Category 2 and 3 are more common in JJA, while category 4 is more common in May and September • Stronger westerlies, more FROPA during “transition months”
Summary – Key Points • ALTs form preferentially during diurnal and seasonal heating maxima • Frequency of each ALT category varies by month • Category 2 and 3 are more common in JJA, while category 4 is more common in May and September • Stronger westerlies, more FROPA during “transition months” • Spatial distribution of storm reports varies by ALT category • Category 2 and 3 have similar distributions within ALT Zone • Category 4 favors DCA–PHL corridor, linked to collocated high CAPE and shear
Contact Information Dan Thompson dthompson@albany.edu http://www.atmos.albany.edu/student/dthompso/
Climatology – Results ← Stricter ← Stricter • Each bubble denotes the percentage of time an ALT is recorded under a particular set of MSLP/temperature anomaly constraints • Boxesindicate the criteria adopted as the ALT definition
Spatial Frequency of Storm Reports by Category – Methodology • Storm reports were binned based on nearest earlier ALT category present • Example: Category 2 ALT occurred at 1800 UTC • Storm reports occurring from 1800 to 2359 UTC fall into the category 2 bin