Download
1 / 35
350 likes | 504 Views
Today's Objectives - Default. Presentation graphicsSelectiveIntentionalFonts, Colors, Backgrounds, Bullets Initial learner comprehensionRetention of conceptsReinforce relatednessVisual literacyInformation literacy. Improving Your Presentation Graphics. Kari E. Boyce, PhDAssociate Dean, Coll

E N D
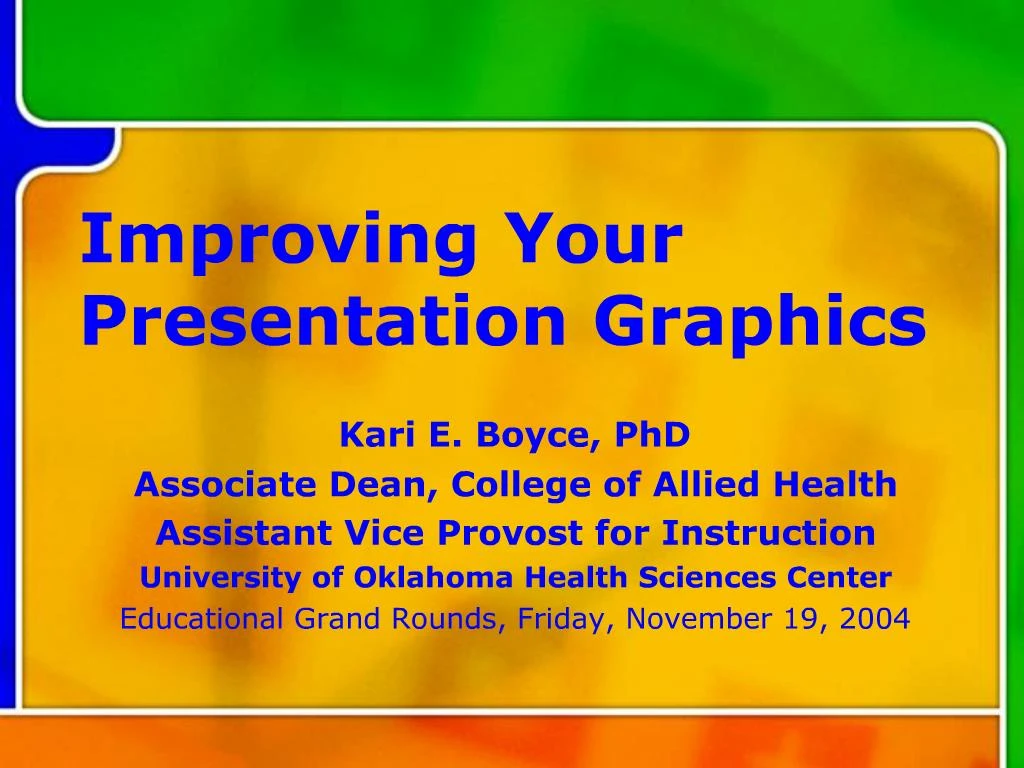
1. Improving Your Presentation Graphics Kari E. Boyce, PhD
Associate Dean, College of Allied Health
Assistant Vice Provost for Instruction
University of Oklahoma Health Sciences Center
Educational Grand Rounds, Friday, November 19, 2004
2. Today�s Objectives - Default Presentation graphics
Selective
Intentional
Fonts, Colors, Backgrounds, Bullets
Initial learner comprehension
Retention of concepts
Reinforce relatedness
Visual literacy
Information literacy
3. Improving Your Presentation Graphics Kari E. Boyce, PhD
Associate Dean, College of Allied Health
Assistant Vice Provost for Instruction
University of Oklahoma Health Sciences Center
Educational Grand Rounds, Friday, November 19, 2004
4. Today�s Objectives Graphics
Selective
Intentional
Fonts, Colors, Backgrounds, Bullets and Graphics
5. Design for Learners Initial learner comprehension
Retention of concepts
Reinforce relatedness
6. Literacy Visual literacy
Information literacy
7. Fonts Face and Type
Serif vs San serif
Serif vs San serif
Size
Point size 24, 36, 44, 54, 60
Color
Contrast Yellow vs Black
8. Colors Contrast
Provoke emotions
Background
Text
Graphics
9. Backgrounds Content
Don�t compete with content!
Readability
Color
Contrast
Empty space
Visual anchors
10. Poor Contrast Solid
Gradient
Photograph
Graphic
11. Layout Location
Margins and �white space�
One concept per slide
Bullets
Order
Number of lines
Number of words
Parallel construction
12. Bullets Order implies emphasis
Use 5x5 or 7x7 rule
Omit periods & commas
Keep grammar parallel
Run spell check
AVOID all capitals
Say more than you show
13. Background Images Is it a background?
Know file location
Alignment & color
14. Image Import
15. Pie Chart
16. Text and Bar Chart x2 (2,26) = 0.178, p = 0.9148
17. Design for Learners Initial learner comprehension
Retention of concepts
Reinforce relatedness
18. Initial Doppler concept
Existing illustration
Simple diagram
19. Doppler Effect Relative motion (source & receiver)
Change in wavelength
Change in perceived frequency
20. Doppler Effect Relative motion (source & receiver)
Change in pitch (ie. music note)
Change in wavelength and frequency
21. Why does the Doppler Effect occur? As a sound source moves, the wavefronts in the forward direction get closer together, while the wavefronts on the far side get farther apart.
Therefore a receiver on the forward side of the source will perceive the sound as having a shorter wavelength and higher frequency (pitch) than a stationary sound source.
A receiver on the far side of the source will perceive the sound as having a longer wavelength and lower frequency (pitch) than a stationary sound source.
22. Retention Informal Quiz
Diagram for reference
23. Retention Add Audio
24. Retention Practice at website
25. Reinforcement Doppler of blood vessel
26. Reinforcement Doppler of blood vessel
http://hyperphysics.phy-astr.gsu.edu/hbase/sound/usound2.html#c1
27. Animation Find graphic
Ungroup
Assemble parts
Group to move
Animate components
Add audio
Save and Test
30. Visual Literacy To understand
use
and create images
to intentionally
communicate with others
From H Napierkowski, Fostering Verbal and Visual Literacy in E-Learning, WCET Conference, November 2002
31. to think
and learn
in terms of images
From H Napierkowski, Fostering Verbal and Visual Literacy in E-Learning, WCET Conference, November 2002
32. Visual Literacy �We are coming to depend on visualization as a vital tool for conceptual thought in ways that were simply impossible before the digitization of information. If we want to prepare our students for the world out there, it must be a new kind of preparation for a transformed world.�
From R Lanham, The Electronic Word, 1993
33. Information Literacy �� the ability to know when there is a need for information, to be able to identify, locate, evaluate, and effectively use that information for the issue or problem at hand.�
From National Forum on Information Literacy, http://www.infolit.org/, 2004
34. Consider� Legible text
Meaningful symbols
Reinforcing repetition
Pause for processing
Summary for self-assessment
35. Make intentional choices
Design for learners
Enjoy connecting
36. EGR Resources http://ouhsc.edu/academicaffairs/education/
kari-boyce@ouhsc.edu