Download
1 / 49
490 likes | 710 Views
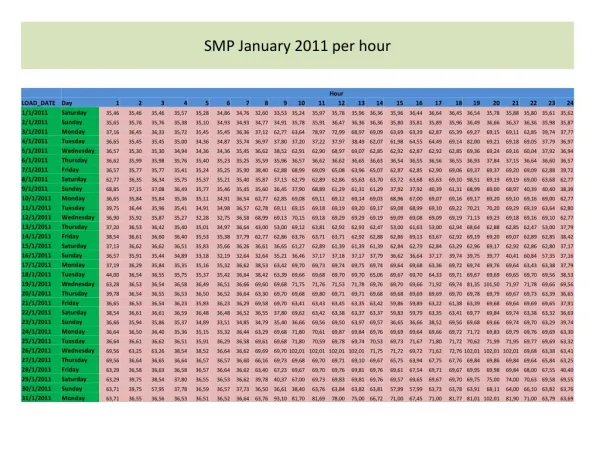
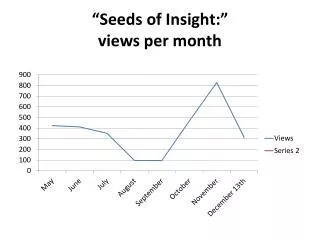
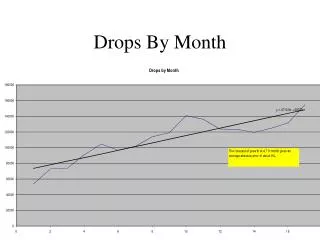
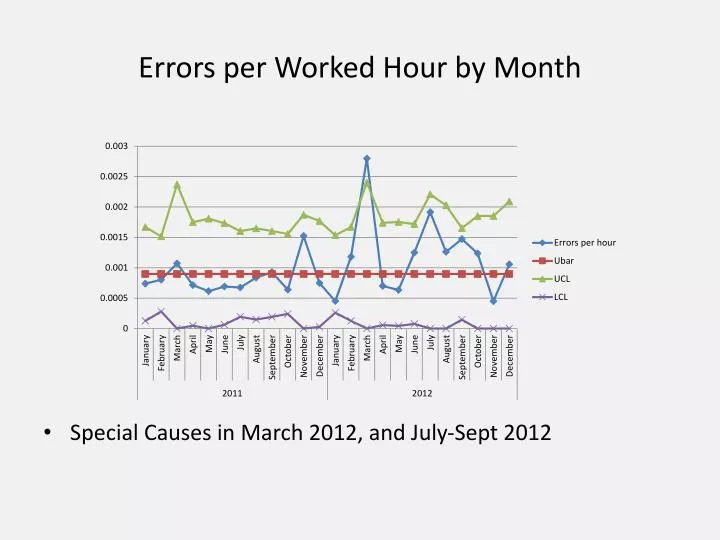
Errors per Worked Hour by Month. Special Causes in March 2012, and July-Sept 2012. Correcting the “Bad Apples”. Error rate falls from .00090 to .00082 . When we “changed the process”. When we changed the process, rate fell to .0049. Sample Sizes. http://vimeo.com/24784020.

E N D
Errors per Worked Hour by Month • Special Causes in March 2012, and July-Sept 2012
Correcting the “Bad Apples” • Error rate falls from .00090 to .00082
When we “changed the process” • When we changed the process, rate fell to .0049
An Introduction to Lean Six Sigma “We don’t know what we don’t know. We can’t act on what we don’t know. We won’t know until we search. We won’t search for what we don’t question. We don’t question what we don’t measure. Hence, we just don’t know.” Dr. Mikel Harry
Process Improvement • Initial problem perception • Clarify problem • Locate point of cause • Root cause analysis • Design solutions • Test to see if worked • Standardize
What is Lean Six Sigma? • A statistical measurement • A measure of quality • A goal • A methodology • A quality improvement initiative • A management philosophy focused on customer satisfaction • A strategy for organizational transformation
Lean Six Sigma Process Improvement • Lean Six Sigma Seeks to improve the quality of manufacturing and business process by: • identifying and removing the causes of defects (errors) and variation. • Identifying and removing sources of waste within the process • Focusing on outputs that are critical to customers
Lean Six Sigma Process Improvement • LSS is a management philosophy that seeks to drive a quality culture change through a multi-level based program
Lean Six Sigma Timeline Six Sigma • Deming • 14 Points • 7 Deadly Diseases Guinness Brewery Shewhart Introduces SPC 1900 1930 1950 Ford Assembly Line • Gilbreth, Inc. • Management Theory • Industrial Engineering Toyota Production System LEAN
Lean Six Sigma Timeline Six Sigma Motorola Introduces Six Sigma AlliedSIgnalGE Adapt LSS to Business Processes SPC TQM LeanSix Sigma 1980 1990 2000 Just – in–Time Lean Mfg. LEAN
Lean Six Sigma Timeline Six Sigma LeanSix Sigma 2000 2013 LEAN
Lean Six Sigma is … An Evolution! • Continuous Improvement can be traced to Taylor’s time studies • Toyota created Lean to achieve Henry Ford’s low cost with GM’s variety of product • Motorola initiated “six sigma” to meet the challenge of Japanese chip quality and cost • Deming, Baldrige and Shingo Prize’s are Descriptive of success • GE Prescribed the Six Sigma infrastructure of success connected to business strategy • Lean Six Sigma integrates Lean lead time and cost reduction with Six Sigma quality and sustaining infrastructure of success
Lean vs. Six Sigma • Lean tends to be used for shorter, less complex problems. Often time driven. Focus is on eliminating wasteful steps and practices. • Six Sigma is a bigger more analytical approach – often quality driven – it tends to have a statistical approach. Focus on optimizing the important steps – reducing defects. • Some argue Lean moves the mean, SixSigma moves the variance. But they are often used together and should not be viewed as having different objectives. • Waste elimination eliminates an opportunity to make a defect • Less rework means faster cycle times • Six Sigma training might be specialized to the “quality” department, but everyone in the organization should be trained in Lean
VOC vs. VOP Voice of Customer Voice of Process The Voice of the Process is independent of the Voice of the Customer
Goals of Lean Six Sigma LSL USL LSL USL Defects Defects Defects Customer Target Customer Target Prevent Defects byReducing Variation Prevent Defects byCentering Process LSL USL Customer Target Meet Customer Requirements
Background on Lean • Lean comes out of the industrial engineering world • TaiichiOhno – Toyota Production System. • 1940s-1950s company was on verge of bankruptcy • Dynamics of industry were changing – moving from mass production to more flexible, shorter, varied batch runs (people wanted more colors, different features, more models, etc). • Ohno was inspired by 3 observations on a trip to America • Henry Ford’s assembly line inspired the principle of flow (keep products moving because no value is added while it is sitting still) • The Indy 500 – Rapid Changeover • The American Grocery Store – led to the Pull system – material use signals when and how stock needs to be replenished
What is Lean? • Lean Enterprise Institute: • “Lean is a set of concepts, principles and tools used to create and deliver the most value from the customers’ perspective while consuming the fewest resources and fully utilizing the knowledge and skills of the people performing the work”
What is Lean? • TaiichiOhno: • “all we are doing is looking at the timeline from the moment a customer gives us an order to the point when we collect the cash. And we are reducing that timeline by removing the non-value-added wastes” • It is about eliminating waste and showing respect for people
Lean Thinking • Work is designed as a series of ongoing experiments that immediately reveal problems • Problems are addressed immediately through rapid experimentation • Solutions are disseminated adaptively through collaborative experimentation • People at all levels of the organization are taught to become experimentalists
Types of Work • Value Added Work • Activities that transform materials or information into something that the customer cares about • Non-Valued Added Work • Necessary • Room changeover • Testing • Administration? • Unnecessary (pure waste) • Re-testing • Waiting for a test • Walking
The Lean House Goals: Safety, Quality, Time, Cost, Morale Quality Flow • Prevent Delays • Value Stream Focus • Pull Systems • Right care, right place, right time • Identify root Cause • Prevent errors at the source • Involve employees • Avoid blame Developing People Heijunka Standardized Work Kaizen (level loading (employee empowerment) (Continuous Improvement)
Lean Foundations • Standardized Work – people should analyze their work and define the way that best meets the needs of all stakeholders. • “The current one best way to safely complete an activity with the proper outcome and the highest quality, using the fewest possible resources” • Standardized not Identical – mindless conformity and the thoughtful setting of standards should not be confused • Written by those who do the work.
Lean Foundations • Heijunka -- Level loading – smoothing the workflow and patient flow throughout the hospital. • Kaizen – continuous improvement • Employee Empowerment • Andon Cord • Jidoka – problems are fixed at the source instead of being passed along and fixed at the source • “Suggestion Box”
Lean Methods • Kaizen Events (or SCORE events) • Planned and structured process that enables a small group of people to improve some aspect of their business in a quick, focused manner. • Select • Clarify • Organize • Run • Evaluate • 5S – this methodology reduces waste through improved workplace organization and visual management • Sort, Store, Shine, Standardize and Sustain • Kanban – a Japanese term that can be translated as “signal,” “card,” or “sign.” • Most often a physical signal (paper card of plastic bin), that indicates when it is time to order more, from whom, and in what quantity.
Scott & White’s Lean Results (2009-2012 • Cost avoidance of $120,455,561 • Cost reduction of $1,200,000 • Increased collections by $4,533,480 • Revenue enhancements of $18,647,340 • Patient throughput by 809,000 patients • Productivity by 944,580 per FTE • Lead time by 253,354 minutes • Process time by502,212 minutes • Staff walking distance by 317,260 feet • Patient wait time by 93,510 minutes • Staff wait time by 1,088,060 minutes
Six Sigma Overview • Diligent attention to managing, improving, and reinventing business processes • Disciplined use of facts, data, and statistical analysis • A close understanding of both internal and external customer needs • Standard deviation (σ) is used to measure the amount of process variation • As sigma gets larger, process variation increases • Variation is the enemy
Six Sigma as a Methodology • Underlying methodology called DMAIC • Empowerment of trained professionals • Formal project charters set the scope and objectives • Various basic quality tools and statistical tools applied during project • Project champion/sponsor both approve project tollgates
Lean & Six Sigma are Synergistic Lean Focus on Waste Elimination supports Six Sigma Quality (waste elimination eliminates an opportunity to make a defect) Six Sigma Goal: Improve process performance in relation to what is critical to the customer Focus: Bias for analysis Method: Uses the DMAIC method and quality tools Deployment: Explicit Infrastructure Customer Satisfaction Lean Goal: Improve process performance through waste elimination & cycle time reduction Focus: Bias for action Method: Implement Lean tools such as Kaizen events, Value Stream Mapping, 5S, TPM etc. Deployment: Implicit infrastructure Speed, Flow, Cost Six Sigma Quality supports Lean Speed (less rework means faster cycle times)
What Makes a Good Six Sigma Project? • There is no known solution • The root cause is not known • The problem is complex and needs statistical analysis • The problem is part of a process • The process is repeatable • A defect can be defined • Project will take 3-6 months • There are data available
The DMAIC Methodology • Define – describe the problem quantifiably and the underlying process to determine how performance will be measured. • Measure – use measures or metrics to understand performance and the improvement opportunity. • Analyze – identify the true root cause(s) of the underlying problem. • Improve – identify and test the best improvements that address the root causes. • Control – identify sustainment strategies that ensure process performance maintains the improved state.
Define • Define Scope of the Problem • Document the Process • Collect and Translate the Voice of the Customer • Determine Project Objective and Benefits • Define Metrics and Defects • Establish Preliminary Baseline • Develop Problem & Objective Statements • Estimate Financial Benefit
Define (continued) • Create Project Charter • Confirm Improvement Methodology • Define Project Roles and Responsibilities • Identify Risks • Establish Timeline • Managerial Buy-in • Focus here is on the problem
MeasureMeasure what is measurable, and make measurable what is not so” – Galileo • Define “As Is” process • Value stream map/process flow diagram • Validate Measurement System for Outputs • Don’t assume your measurements are accurate – measuring system must accurately tell what is happening • Quantify Process Performance • Collect data (Y’s) • Examine process stability/capability analysis
Analyze • Identify Potential Causes (X’s) • Investigate Significance of X’s • Collect data on x’s • Graphical/Quantitative analysis • Pareto Chart • Fishbone Diagram (cause and effect) • Chi Square Test • Regression Analysis • Failure Mode Effects Analysis • Identify Significant Causes to focus on (y=f(X)) • Evaluate the impact of x’s on y • Here you identify the critical factors of a “good” output and the root causes of defects or “bad” output.
Improve • Generate Potential Solutions • Select & Test Solution • Develop Implementation Plan
Control • Create Control & Monitoring Plan • Mistake proof the process • Determine the x’s to control and methods • Determine Y’s to monitor • Implement Full Scale Solution • Revise/develop process • Implement and evaluate solution • Finalize Transition • Develop transition plan • Handoff process to owner