Download
1 / 6
70 likes | 224 Views
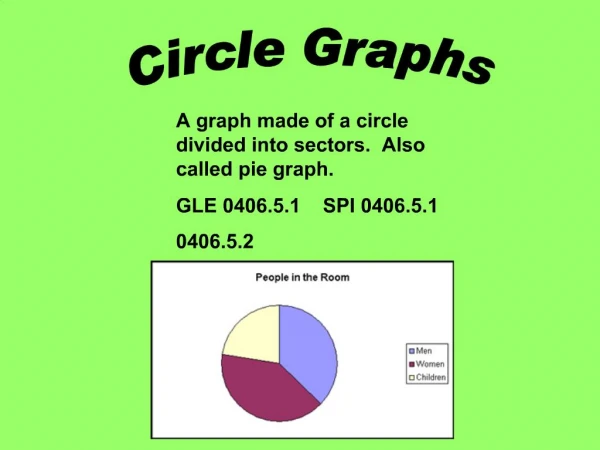
Goal 9.5 Circle Graphs. A circle graph displays data as sections of a circle. The entire circle represents all the data. Each section is labeled using the actual data or using the data expressed as fractions, decimals, or percents of the sum of the data. Using Angles.

E N D
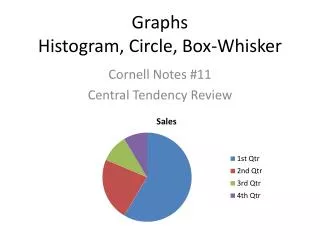
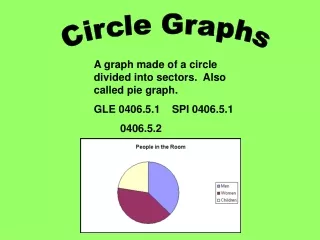
Goal 9.5 Circle Graphs • A circle graph displays data as sections of a circle. The entire circle represents all the data. Each section is labeled using the actual data or using the data expressed as fractions, decimals, or percents of the sum of the data.
Using Angles • The sections of a circle graph can be described mathematically using angles. A ray is apart of a line. It begins at a point and extends in one directions without end. An angle consists of two rays that begin at a common point, call the vertex. The plural of vertex is vertices.
Continue…. • You can use a protractor to find the measure on an angle. Angles are measured in units called degrees ( ˚ )
Example 2: Making a circle graph Given Percents • The table shows the results of survey that asked students about the kind of building in which they live. Display the data in a circle graph.
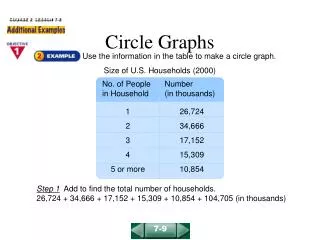
Example 3: Making a Circle graph Given Data • The Table shows the number of juices sold during one lunch in the school cafeteria. Display the data in a circle graph.