Download
1 / 1
10 likes | 185 Views
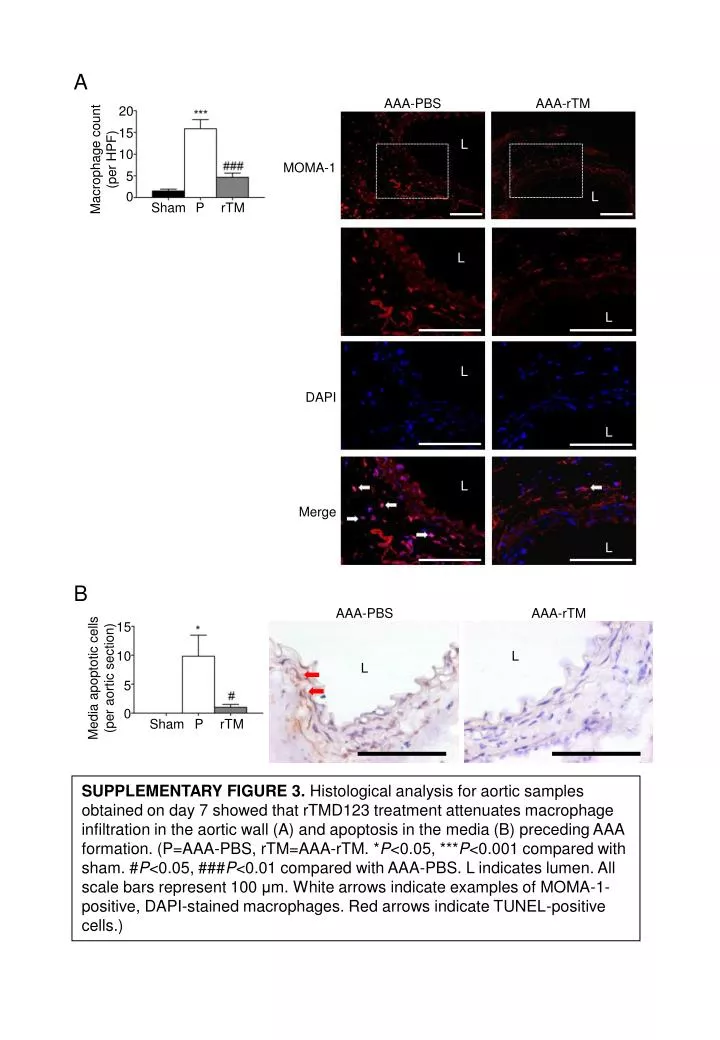
A. AAA-PBS. AAA- rTM. 20. Macrophage count (per HPF). 15. L. 10. MOMA-1. 5. L. 0. Sham. P. rTM. L. L. L. DAPI. L. L. Merge. L. B. AAA-PBS. AAA-rTM. Media apoptotic cells (per aortic section). 15. 10. L. L. 5. 0. Sham. P. rTM.

E N D
A AAA-PBS AAA-rTM 20 Macrophage count (per HPF) 15 L 10 MOMA-1 5 L 0 Sham P rTM L L L DAPI L L Merge L B AAA-PBS AAA-rTM Media apoptotic cells (per aortic section) 15 10 L L 5 0 Sham P rTM SUPPLEMENTARY FIGURE 3. Histological analysis for aortic samples obtained on day 7 showed that rTMD123 treatment attenuates macrophage infiltration in the aortic wall (A) and apoptosis in the media (B) preceding AAA formation. (P=AAA-PBS, rTM=AAA-rTM. *P<0.05, ***P<0.001 compared with sham. #P<0.05, ###P<0.01 compared with AAA-PBS. L indicates lumen. All scale bars represent 100 μm. White arrows indicate examples of MOMA-1-positive, DAPI-stained macrophages. Red arrows indicate TUNEL-positive cells.)