Download
1 / 1
20 likes | 146 Views
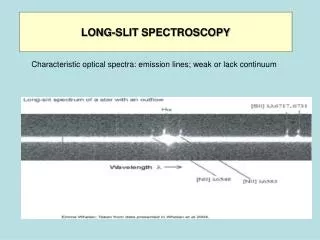
X axis: Wavelengths Y axis: Positions Slit 16:Left most / Slit 1: Right most Top: Northeast / Bottom: Southwet. Multi-long-slit Spectroscopy for Kinematic Studies. I. Implementation and Demonstration Rene A. M. Walterbos, Jiehae Choi, Sophia Cisneros, Maria T. Patterson, Cat Wu

E N D
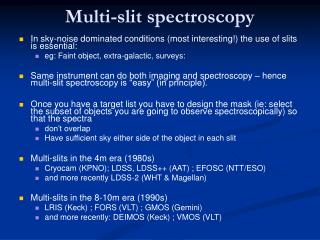
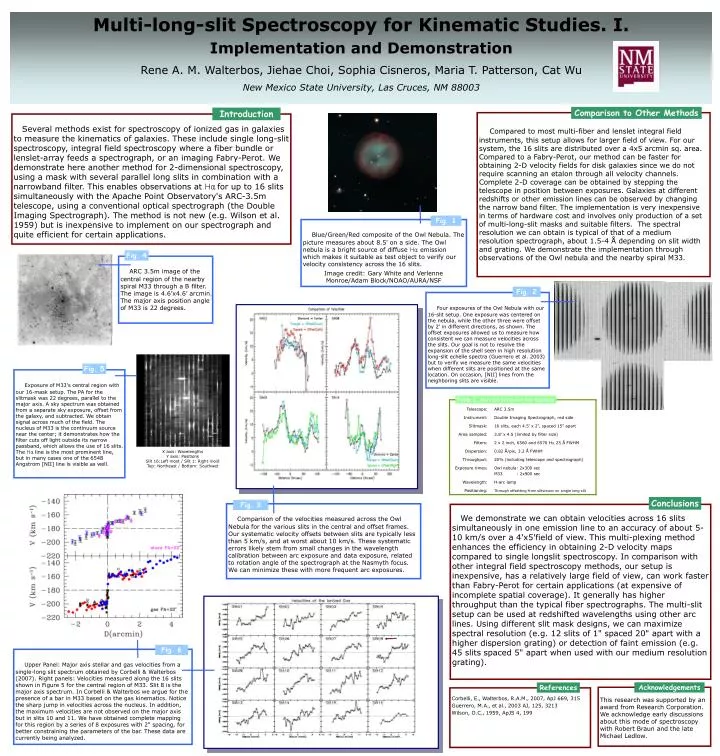
X axis: Wavelengths Y axis: Positions Slit 16:Left most / Slit 1: Right most Top: Northeast / Bottom: Southwet Multi-long-slit Spectroscopy for Kinematic Studies. I. Implementation and Demonstration Rene A. M. Walterbos, Jiehae Choi, Sophia Cisneros, Maria T. Patterson, Cat Wu New Mexico State University, Las Cruces, NM 88003 Comparison to Other Methods Introduction Compared to most multi-fiber and lenslet integral field instruments, this setup allows for larger field of view. For our system, the 16 slits are distributed over a 4x5 arcmin sq. area. Compared to a Fabry-Perot, our method can be faster for obtaining 2-D velocity fields for disk galaxies since we do not require scanning an etalon through all velocity channels. Complete 2-D coverage can be obtained by stepping the telescope in position between exposures. Galaxies at different redshifts or other emission lines can be observed by changing the narrow band filter. The implementation is very inexpensive in terms of hardware cost and involves only production of a set of multi-long-slit masks and suitable filters. The spectral resolution we can obtain is typical of that of a medium resolution spectrograph, about 1.5-4 Å depending on slit width and grating. We demonstrate the implementation through observations of the Owl nebula and the nearby spiral M33. Several methods exist for spectroscopy of ionized gas in galaxies to measure the kinematics of galaxies. These include single long-slit spectroscopy, integral field spectroscopy where a fiber bundle or lenslet-array feeds a spectrograph, or an imaging Fabry-Perot. We demonstrate here another method for 2-dimensional spectroscopy, using a mask with several parallel long slits in combination with a narrowband filter. This enables observations at Hαfor up to 16 slits simultaneously with the Apache Point Observatory's ARC-3.5m telescope, using a conventional optical spectrograph (the Double Imaging Spectrograph). The method is not new (e.g. Wilson et al. 1959) but is inexpensive to implement on our spectrograph and quite efficient for certain applications. Fig. 1 Blue/Green/Red composite of the Owl Nebula. The picture measures about 8.5' on a side. The Owl nebula is a bright source of diffuse Hα emission which makes it suitable as test object to verify our velocity consistency across the 16 slits. Image credit: Gary White and Verlenne Monroe/Adam Block/NOAO/AURA/NSF Fig. 4 ARC 3.5m image of the central region of the nearby spiral M33 through a B filter. The image is 4.6’x4.6’ arcmin. The major axis position angle of M33 is 22 degrees. Fig. 2 Four exposures of the Owl Nebula with our 16-slit setup. One exposure was centered on the nebula, while the other three were offset by 2' in different directions, as shown. The offset exposures allowed us to measure how consistent we can measure velocities across the slits. Our goal is not to resolve the expansion of the shell seen in high resolution long-slit echelle spectra (Guerrero et al. 2003) but to verify we measure the same velocities when different slits are positioned at the same location. On occasion, [NII] lines from the neighboring slits are visible. Fig. 5 Exposure of M33's central region with our 16-mask setup. The PA for the slitmask was 22 degrees, parallel to the major axis. A sky spectrum was obtained from a separate sky exposure, offset from the galaxy, and subtracted. We obtain signal across much of the field. The nucleus of M33 is the continuum source near the center; it demonstrates how the filter cuts off light outside its narrow passband, which allows the use of 16 slits. The Hαline is the most prominent line, but in many cases one of the 6548 Angstrom [NII] line is visible as well. Table 1. Muli-slit setup for the testdata Conclusions Fig. 3 Comparison of the velocities measured across the Owl Nebula for the various slits in the central and offset frames. Our systematic velocity offsets between slits are typically less than 5 km/s, and at worst about 10 km/s. These systematic errors likely stem from small changes in the wavelength calibration between arc exposure and data exposure, related to rotation angle of the spectrograph at the Nasmyth focus. We can minimize these with more frequent arc exposures. We demonstrate we can obtain velocities across 16 slits simultaneously in one emission line to an accuracy of about 5-10 km/s over a 4'x5'field of view. This multi-plexing method enhances the efficiency in obtaining 2-D velocity maps compared to single longslit spectroscopy. In comparison with other integral field spectroscopy methods, our setup is inexpensive, has a relatively large field of view, can work faster than Fabry-Perot for certain applications (at expensive of incomplete spatial coverage). It generally has higher throughput than the typical fiber spectrographs. The multi-slit setup can be used at redshifted wavelengths using other arc lines. Using different slit mask designs, we can maximize spectral resolution (e.g. 12 slits of 1" spaced 20" apart with a higher dispersion grating) or detection of faint emission (e.g. 45 slits spaced 5" apart when used with our medium resolution grating). Fig. 6 Upper Panel: Major axis stellar and gas velocities from a single-long slit spectrum obtained by Corbelli & Walterbos (2007). Right panels: Velocities measured along the 16 slits shown in Figure 5 for the central region of M33. Slit 8 is the major axis spectrum. In Corbelli & Walterbos we argue for the presence of a bar in M33 based on the gas kinematics. Notice the sharp jump in velocities across the nucleus. In addition, the maximum velocities are not observed on the major axis but in slits 10 and 11. We have obtained complete mapping for this region by a series of 8 exposures with 2" spacing, for better constraining the parameters of the bar. These data are currently being analyzed. Acknowledgements References This research was supported by an award from Research Corporation. We acknowledge early discussions about this mode of spectroscopy with Robert Braun and the late Michael Ledlow. Corbelli, E., Walterbos, R.A.M., 2007, ApJ 669, 315 Guerrero, M.A., et al., 2003 AJ, 125, 3213 Wilson, O.C., 1959, ApJS 4, 199