Download
1 / 91
970 likes | 1.2k Views
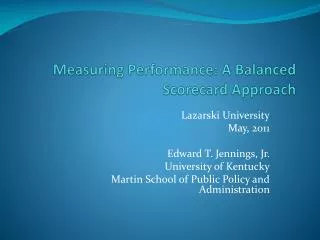
Performance Management Using the Balanced Scorecard Approach. Office of Quality Management Office of Research Services National Institutes of Health May 2004. For more information on Performance Management in the Office of Research Services: http://www.nih.gov/od/ors/od/oqm/pm/index_pm.htm

E N D
Performance Management Using the Balanced Scorecard Approach Office of Quality Management Office of Research Services National Institutes of Health May 2004
For more information on Performance Management in the Office of Research Services: http://www.nih.gov/od/ors/od/oqm/pm/index_pm.htm Or Contact: Amy Culbertson Culberta@ors.od.nih.gov (301) 594-9616 Acknowledgments This training was developed by the Balanced Scorecard for Government, Inc., in collaboration with the Office of Quality Management.
Training Objectives • Understand the ORF/ORS history with Performance Management • Review the basics of the Balanced Scorecard (BSC) approach • Understand the Role of the PMP “Teams” • Become familiar with the ORF/ORS Performance Management Plan (PMP) • Understand value propositions and strategy statements • Review how to develop objectives for the four BSC perspectives • Learn how to link objectives through strategy maps
Performance Management’s Roots in ORF/ORS • Started with ORS Leadership and the theme of how do we demonstrate to customers that we are providing good value • They are getting what they pay for • We are matching demand with needs • Under Deputy Director’s guidance, applied simplified concept of ABC to our organizations • Two day retreat occurred in which the first Services Hierarchy was established • Provided framework to describe the services we deliver to NIH • Help us cost from inputs to outcomes • Then needed a way to track how we are doing • Started with the Service Area Reviews (SARs) • Subset of service providers presented review of their operations every three years
Performance Management’s Roots in ORF/ORS • Germ for more frequent measurement and improvement came from discussions between the NIH Associate Director for Research Services and the OQM Director, and a subsequent trip to London to the Defense Evaluation Research Agency • Science and engineering organization in England that is similar to ORS • They would meet with customers annually to evaluate how they did on their objectives, review their plans for the future • Managers were rewarded based on their accomplishments • Came back and decided to do what was known as the Annual Self Assessments (ASA) here • Began as a pilot in April 2001 with just 1/4 of the discrete services • Held the first conference in October 2001 • Modified approach based on customer inputs and organization needs • Went to organization-wide implementation in FY02 • All 42 Service Groups involved in the effort • All groups presented at the second conference in November 2002 • Organization-wide implementation continued during the next year (Jan 2003 - Jan 2004) • All ORS and ORF Service Groups were involved in the effort • Some new groups formed due to changes in the Services Hierarchy • One-third of the Groups presented at the third conference in January 2004
The Performance Management Process and Continual Improvement (P-D-C-A cycle) New teams are here ACT PLAN Step 4 Implement Change Step 1 Review/ Establish PMP Step 2 Develop/ Enhance Measures A few are here CHECK DO Step 3 Measure & Analyze Most teams are here
Purpose of Performance Mangement • Implement a culture in ORF/ORS that manages and improves through the use of performance data • Gauge extent to which we are delivering what customers want and need • Use data to make process improvements • Plan how to invest in people and tools to be innovative and competitive • Understand reasons for change in costs and funding needs • Making funding allocation decisions based on data-based business case
Performance Management - What’s in it for me? • Provides opportunities to better understand your mission/function/job • Gives you tools to accurately assess your customers’ needs, satisfaction, and know how to improve service delivery to them • Provides opportunities to influence operational processes and decisions • Encourages addressing issues related to cross-functional service delivery that can cause grief for all involved • Provides a vehicle to showcase what you do and the value you deliver to NIH customers • Strives to integrate the budgeting process with future program needs based on data so you have the resources you need • Increases your skills in strategic planning, performance measurement, data collection/analysis, and process improvement • Provides an opportunity to best prepare your area for competitive sourcing initiatives that may impact you
Who made this up? • Dr. Robert Kaplan and Dr. David Norton • Research at Harvard University • Research showed that organizations were… • Placing too much emphasis on financial measures - (not in balance) • Downsizing to address short-term financial problems - (reactive not proactive) • Responding to Wall Street analysts, not customers
What is a Balanced Scorecard? • A structured way to look at our organization (a set of lenses) • A simplified way to tell story • Structure (rules of thumb) • 4-5 perspectives • 3-4 objectives per perspective • 2-3 measures per objective • 3-5 initiatives per objective
What is a Balanced Scorecard? (cont.) At the highest level, it is a framework that helps organizations translate strategy into operational objectives that drive both behavior and performance.
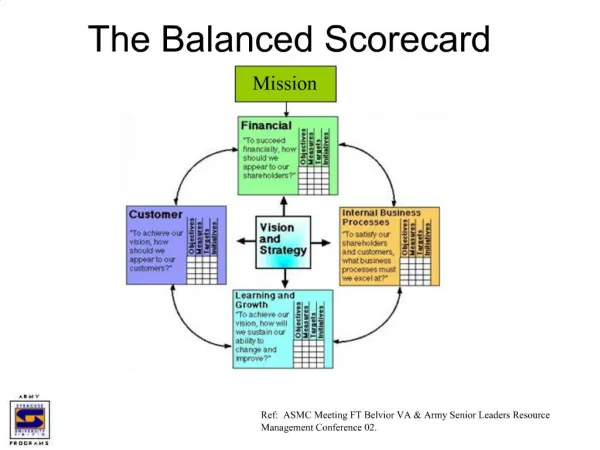
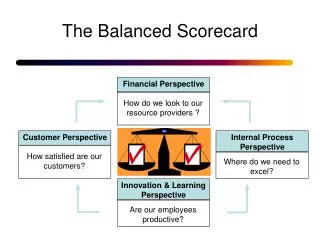
The Balanced Scorecard Framework How do we exceed Customer/stakeholder expectations? What do our customers/ stakeholders look for in financial results? What process do we need to improve to fulfill these expectations? What skills, tools, and culture are required to perform these processes?
Customer Financial Internal Learning The Balanced Scorecard for Your Organization How do we exceed Customer/stakeholder expectations? What do our customers/ stakeholders look for in financial results? What process do we need to improve to fulfill these expectations? Strategy What skills, tools, and culture are required to perform these processes?
Why do we need to do this? Today’s Organizations Are Expected to Be: • Competitive (sourcing) • Accountable • Customer-friendly • Fiscally responsible External world is highly unstable so planning systems must deal with uncertainty 1. Strategy is a hypothesis. 2. Strategy is a dynamic process. 3. Strategy is everyone’s job. 4. Organizations are systems that must sense, experiment, learn, and adapt. 5. Strategy is an articulation of the direction we want to take an organization. Structure Is Strategy Adapted from “Planning Is Dead, Long Live Planning, “ Jos. Fuller, Across the Board, March 1998.
What Roles Do the PM “Teams” Play? • Team Leader - a manager or senior member of your staff who takes the responsibility for applying PM in the organization; • Team Members - typically 4-8 staff members who understand the complexities of your current work environment. Team members provide functional expertise to assist the team leader in development and implementation of your PMP; • Consultant - Either OQM staff or contractor assigned to each team to provide technical assistance and coaching on the process, tools and methodology; • OQM Staff – In addition to provide consultation to teams, OQM assists teams at key points during development and implementation, and interface with Senior Management on the overall progress of the PM effort.
What is the PMP? • The Performance Management Plan (PMP) is your business roadmap • Lists the name of your Service Group and Discrete Services from the Services Hierarchy maintained by OBSF • Describes your value to the NIH • Defines how you implement your value (your strategy) • Highlights your performance objectives • Identifies how you measure achievement on objectives • Lays out targets for delivering performance
Key actions or projects required to achieve outcomes and their corresponding owners How success will be measured and tracked: How we will know we are done Statement of what should be achieved: An Outcome The level of performance or rate of improvement needed over time Note: Page 2 of the PMP.
Value Proposition The Value Proposition should be established with the Research Community in mind and should be derived using the following formula: Value = Product and/or service attributes + image + relationship The value proposition should establish why we do what we do, and what impact does it have on the community for whom we provide our services.
What is the value propositionfor your Service Group? • What is the contribution that we make to the NIH Research Community and other interested parties? • Customers • Stakeholders • It is a theory that must be tested
First, you must consider “Who are our customers?” • Customers: • Are the recipients of our goods and services • Are the direct beneficiaries • May also be stakeholders • Stakeholders: • Influence budget, funding, and resource allocations • Are alter egos of customers • Fill a stewardship or regulatory role Note: Customer segmentation data should clarify your customers/stakeholders.
EXAMPLE Stakeholders • ORS Advisory Committee • IWG and MBWG • FARB • DHHS • OMB/GAO/Congress • OSHA • JCAHO/AAALAC Customers • The NIH Institutes • ORS program managers • ORS service providers • ORS administrators
Why do we distinguish stakeholders from other customers? • Stakeholders have different issues • Need different approach • Stakeholders can increase or decrease funding (regardless of how customers feel) • Stakeholders can formulate or influence policy • Customers and stakeholders may each value something different
What do customers really want? • What value do we provide to customers? • What would happen to customers if we were no longer around? • How much are customers willing to pay for our products/services? • What is our obligation to customers? • What can we do to ensure their support? • What can we do to better educate them?
What do stakeholders really want? • What do our stakeholders value? • How does what they value differ from what our customers value? • What is our obligation to stakeholders? • What can we do to ensure their support? • What can we do to better educate them?
Functionality Quality Price Time The Value Proposition EXAMPLE Generic Model The value proposition should establish “why” Value = (Product / Service Attributes) + Image + Relationship Example: Federal Agency Product/Service Attributes Image Relationship Accessible (Services) Consistent (Products) Dedicated (People) Professional (Staff) Personal Relationships (Customers) Service Oriented (Employees) VALUE PROPOSITION STATEMENT “We bring value to NIH by providing our customers with convenient, accessible, and consistent services to ensure that visiting scientists acquire the required visas in the least amount of time at the best price to the agency.”
Functionality Quality Price Time What is the VALUE PROPOSITION for your Service Group? Product/Service Attributes Image Relationship ? ? ? ? ? ? What value do we offer our customers/stakeholders? Why are you in business? Value = (Product / Service Attributes) + Image + Relationship
Type your Value Proposition on your Performance Management Plan (PMP) Type in value proposition (VP) here.
What is strategy? Think of Strategy as a Way to Get to Your Destination Strategy
Informed executives managing a strategic agenda The Power To Rapidly Implement Strategy, Learn, and Improve Motivatedworkforce implementing strategy and documenting progress The BSC Provides Structure and Context for Effective Strategic Management
Strategic Management Is Based Upon a “Double Loop” Learning Approach The Strategy Financial Perspective StrategicFeedback& Learning Customer Perspective Internal Perspective update the strategy test the hypotheses Learning Perspective Strategic Learning Loop Balanced Scorecard • Strategic Objectives • Financially Strong • Delight the Consumer • Win-Win Relationship • Safe & Reliable • Competitive Supplier • Motivated & Prepared • Strategic Measures • Return of Capital Employed • Mystery Shopper Rating • Dealer/Pioneer Gross Profit Split • Manufacturing Reliability Index • Days Away from Work Rate • Laid Down Cost vs. Best Competitive Ratable Supply • Strategic Competency Availability Financial Cust corrections result Internal L&G Operational Control Loop Performance Initiatives & Programs input output
Ways to Characterize Strategy • Michael Porter (author of Competitive Strategy )says there are three general ways to characterize strategy in organizations: • Operational Excellence • Customer Intimacy • Product Leadership • Fee for Service Organizations should also think about where your business is in terms of: • Growth • Sustain • Harvest
Availability Responsiveness Convenience Competence Handling of Problems Cost Quality Timeliness Reliability Operational Excellence Is Customer Service Excellence Your Service AttributesYour Product Attributes
Understand their business Know their needs Provide complete solutions Quality of the relationship Empower them Share with them Our team knows their team Follow up and feed back Customer Intimacy Is Customer Quality Relationships
Culture for risk taking Entrepreneurial vs. bureaucracy Team player over experience Exist on limited planning and analysis Fast reaction times to conditions Open Mindedness (avoid Not Invented Here Syndrome) Service and products always state-of-art Creativity over formula Engineered for speed Knowledge management “First” initiative A budget for failure (Command of Capital) Product Leadership is Customer Needs Filled With New Solutions
Indicate your Strategy on your PMP Check which box best describes your strategy.
Elaborate on Your Strategy • Think more deeply about your strategy choices • Write your own strategy statement • May help to develop a strategy map • What may help with expanding your thinking on strategy? • What demands are the customers or “chain of command” placing on the Service Group? • Are your customer demands for services changing dramatically? • Has the environment changed to require new products/services, or service levels, from your group? • Are there expectation for reduced unit cost? • What is the future direction of your Service Group?
“ We will pursue our strategy of operational excellence by providing more timely information to our customers through automation. We will educate our customers regarding regulations and requirements through rigorous training programs. Our focus will be on enabling our professional, experienced staff to provide more dedicated customer-service time.” Operational Excellence Strategy
Describe Service Group Strategy on your Performance Management Plan (PMP) Describe your strategy here.
From Strategy to Objectives….. Next, our focus will be on crafting the objectives. Objectives should enable the achievement of your value proposition and strategy.
Perspective Customer Internal Business Process Learning and Growth Financial Information Needed Customer/stakeholder segmentation, value proposition and strategy Process maps, process data, value proposition and strategy Future needs of the customer and the organization, enablers (people, tools, culture) to get there, value proposition and strategy Customer demands for services/service levels, willingness to pay for services, funding levels available for Service Group, value proposition and strategy Objectives Objectives are a means to achieve your value proposition and strategy.
Crafting Objectives By Perspective Customer Internal Processes Financial Learning & Growth
What Do Our Customers Really Want? (Outcome or “end-state”) What are we really trying to accomplish as a Service Group? What outcomes are we offering customers with our Service Group/Discrete Service offerings? What will our customer base look like 5-7 years from now? What will our customer needs be in the future?