Download
1 / 14
150 likes | 320 Views
OCT & G laucoma : vantaggi e limiti. No financial interest. HD-OCT & Glaucoma: Why ?. RNFL ONH GCC AS-OCT Combo Report. RNFL. GCC. Combo Report. ONH. AS-OCT. RGC & Mean Deviation. 5000/9000 Retinal Ganglion Cells/ Year.

E N D
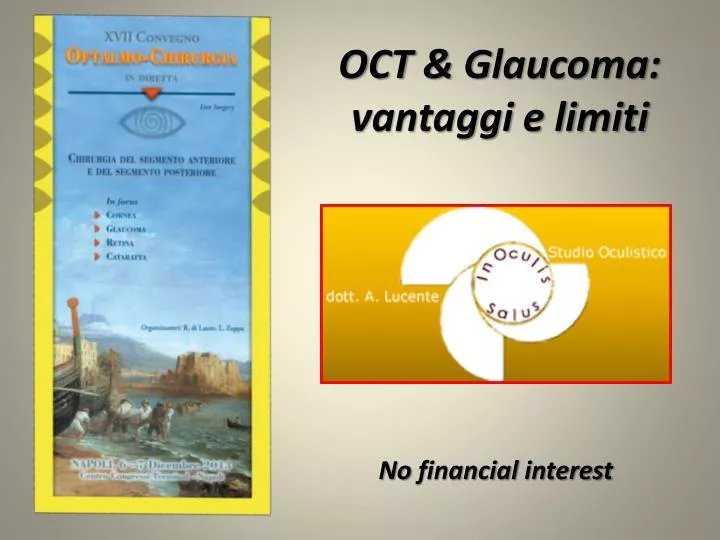
OCT & Glaucoma: vantaggi e limiti No financialinterest
HD-OCT & Glaucoma: Why? • RNFL • ONH • GCC • AS-OCT • Combo Report RNFL GCC Combo Report ONH AS-OCT
RGC & Mean Deviation 5000/9000 Retinal Ganglion Cells/Year Adapted from Medeiros FA, Lisboa R, Weinreb RN, et al. A combinedindex of structure and function for stagingglaucomatousdamage. Arch Ophthalmol. 2012; 130 (5)
Mean Deviation MD (dB) Average Thickness (µm) Estimated RCG count (x10.000 cells) - Atearly stagesof damage (high RGC counts), changes in estimatedRGCcounts correspond to relatively smaller changes in MD(continuous line) andrelativelylarger changes inaverage RNFL thickness (dashed line). - Atadvancedstagesof damage (low RGC counts), changes in estimatedRGCcounts correspond to relatively large changes in MD, butonlysmall changes in average RNFLthickness. MD CV HFA Thickness μm HD-OCT Cirrus Felipe A. Medeiros, Linda M. Zangwill, Christopher Bowd, KawehMansouri, and Robert N. Weinreb Investigative Ophthalmology & Visual Science, October 2012, Vol. 53, No. 11
CSFI Combined Structure Function Index Felipe A. Medeiros, Renato Lisboa, Robert N. Weinreb, Christopher A. Girkin, Jeffrey M. Liebmann, Linda M. Zangwill. ArchOphthalmol. 2012 Douglas GR, Drance SM, Schulzer M. A correlation of fields and discs in open angle glaucoma. Can J. O. 1974
AS HD-OCT IOL IOL
AS HD-OCT LOOP acqueo
Piattaforme Multimediali & Combo Report Zeiss Cirrus & Humphrey con FORUM Heidelberg Spectralis & HEP con HEYEX Optovue & Octopus Bundle Haag-Streit *
Garway-Heath, Moorfields Eye Hospital London Map representing the relationshipbetweenStandard Automated Perimetryvisual field sectors and sections of the peripapillaryOCT scan circle. This map is based on the work of Garway-Heathet al and shows the correspondencebetween areas of the visual field and peripapillary retinal nerve fiber layer due to the anatomical configuration of the retinal nerve fiber bundles.First Release : Presented in part at the Glaucoma Society (UK & Eire) Annual Meeting, London, England, November 1998
Six corresponding regions of neuroretinal rim area (A), peripapillary retinal nerve fiber layer (B), and visual field (C), used to measure the structure–function relationship (based on structure–function map introduced by Garway-Heath et al.) Nilforushan N et al. Invest Ophthalmol Vis Sci. 2012 May A = Rim Area ST + SN : 80°+ C = CV IN + IT : 80° + Nasal : 110° + Temporal : 90° = Rim / RNFL: 360° B = RNFL
Forum Glaucoma Workplace Combined structure and function reports A. Lucente Database HFA : 422 ≥ 18aa età ≤ 89aa + 5D ≥ Range ≤ + 5D
Forum Glaucoma Workplace Combined structure and function reports A. Lucente
Limits HD-OCT • Opacity • Range • Tilting retina • Resolution • Deep Resolution • Agreement • Database • High Costs • In the later stages of glaucoma OCT measurements appear to reach a plateau