Download
1 / 13
150 likes | 376 Views
Correlation of Height and Shoe Size. Members of our research team: Tremayne Mikalauski Rebekah Skinner Jared Mackay Edinson Navarro. Statistical Question to Answer: Is there a correlation between height and shoe size?. Our Hypothesis:

E N D
Members of our research team: Tremayne Mikalauski Rebekah Skinner Jared Mackay Edinson Navarro
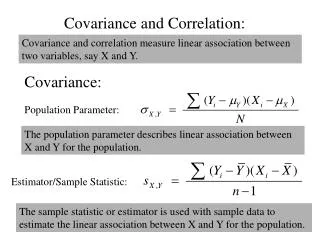
Statistical Question to Answer: Is there a correlation between height and shoe size?
Our Hypothesis: It may be assumed that the taller a person is means the larger the shoe size they will have. The X data is the height in centimeters and the Y data is the size of shoe. There is in fact a correlation between the height of a person and their shoe size. The shoe size of the person is dependent on the persons height.
Data was collected from 40 students to see if their height correlated with their shoe size. In order to get the most accurate calculation for this study, only people who were over the age of sixteen were used. The Table to the right displays the data that was collected from each number of students for their height and shoe size.
Scatter Plot of Data obtained • The scatter plot to the right shows the data Height (X) and Shoe Size (Y) data inputted into a simple scatter plot. With the several tables and charts below summarized in different ways we will be able to determine if there is in fact a correlation between height and shoe size.
Data Analysis/Mathematical Process. First lets look at a scatter plot of the collected data. The Graph to the right shows the height vs. shoe size; and indicates that there is a strong correlation. And when comparing the Table II Critical Values for Correlation Coefficient with our calculated r value of 0.8991 it appears that a significant correlation exists in our data set.
Next we calculate the predicted y values using our best-fit line equation of (y = 0.25 x – 33.4). We can then calculate the residuals using the formula (observed y – predicted y). The Table to the right displays the residual vs. x data.
Next we plot the residual (observed y – predicted y) vs. x. The Graph to the right shows that there is no discreet pattern in the data, nor does the spread of the residuals increase or decrease, therefore we can conclusively say that the data are linearly correlated.
Predictions: Now we can predict y by using various x values in our best-fit line equation of : (y = 0.25 x – 33.4) or (Shoe Size = 0.25 Height – 33.4) to test. The Graph to the right illustrates the existing data and the tested values.
Afterthought: The data shows that the two variables, height and shoe size, have a strong correlation .Our r value of .8991 shows a strong linear correlation. Our evidence supports that in regards to most circumstance the larger your shoe size the taller you are. The data we had collected was from another student working on a similar project. The data consists of height and shoe size from 40 people which include students and/or teachers over the age of 16. The data however was not accounting for the world population. A larger range of race and ancestry inheritances could alter some of the data. The limitations our data could possibly face is the fact that male and female genders continue to grow until a certain age. This may be until early to middle 20’s.
Work Cited/Data Source: • Deloti. Slideshare.net. N.p., n.d. Web. 11 July 2013. <http://www.slideshare.net/deloti/correlation-of-height-and-shoe-size>. • Sullivan III, M. Statistics informed decisions using data. III. Table II. Upper Saddle River, New Jersey: Pearson Education Inc., 2010. Print.