Download
1 / 46
460 likes | 467 Views
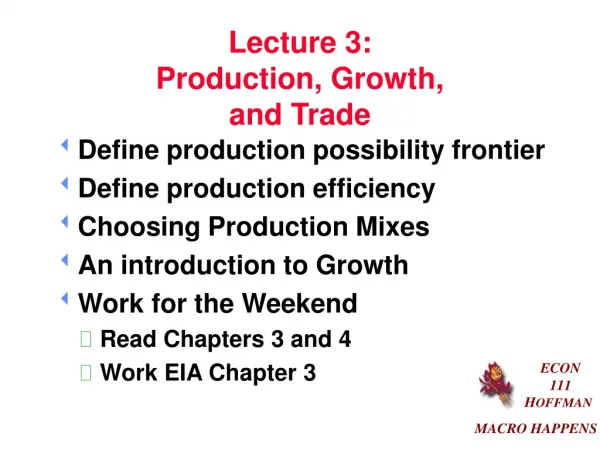
Lecture 9 : Production and Growth. Aggregate Demand and Supply. The aggregate demand curve The aggregate supply curve Equilibrium. Aggregate demand and aggregate supply. P e. a. b. P 2. AS. Price level.

E N D
Aggregate Demand and Supply • The aggregate demand curve • The aggregate supply curve • Equilibrium
Aggregate demand and aggregate supply Pe a b P2 AS Price level If the price level is initially P2, the excess demand will cause price level to rise to Pe. AD O National output
Aggregate Demand and Supply • The aggregate demand curve • The aggregate supply curve • Equilibrium • shifts in the AD curve • shifts in the AS curve
Introducing Economic Growth Actual and potential output actual ouput potential output output gap actual output minus potential output
Introducing Economic Growth Actual and potential output actual ouput potential output output gap actual output minus potential output • Actual and potential growth • actual growth • the % increase in actual output • potential economic growth • the % increase in the economy’s capacity
Growth and the production possibility curve b Growth in actual output a Good X O Good Y
Growth and the production possibility curve Growth in potential output II b Good X Growth in actual output a I O Good Y
Economic growth and the business cycle fluctuations in actual growth Short-term Growth and the Business Cycle
The business cycle Full-capacity output Actual output National output O Time
Short-term Growth and the Business Cycle Economic growth and the business cycle fluctuations in actual growth • the phases of the business cycle • upturn • expansion • peaking out • slowdown or recession
The business cycle 3 4 2 1 Full-capacity output National output Actual output 3 4 2 1 O Time
Short-term Growth and the Business Cycle Economic growth and the business cycle fluctuations in actual growth the phases of the business cycle upturn expansion peaking out slowdown or recession • long-term output trend • sustainable national income • output gaps
The business cycle Trend output Full-capacity output National output Actual output O Time
QWhich one of the following is definitely true? Actual growth can never be greater than potential growth. Actual output can never be greater than potential output. If potential output exceeds actual output there is a negative output gap. If actual growth exceeds potential growth there is a positive output gap. All of the above.
Short-term Growth and the Business Cycle The business cycle in practice economic volatility the length of the phases the magnitude of the phases
Explanations of the Business Cycle • Causes of fluctuations in actual growth • Fluctuations in aggregate demand • instability of private-sector spending • fluctuations in consumer spending
Explanations of the Business Cycle • Fluctuations in aggregate demand • the accelerator • the volatility of investment • changes in national income and induced investment • the accelerator coefficient: Ii = Y
QThe accelerator theory of investment states that the level of investment depends on: the rate of interest. the level of saving. the level of national income. the size of changes in national income. the degree of slack in the economy.
Explanations of the Business Cycle • Fluctuations in aggregate demand • the accelerator • the volatility of investment • changes in national income and induced investment • the accelerator coefficient: Ii = Y • the multiplier/accelerator interaction • fluctuations in stocks
Explanations of the Business Cycle Why do booms and recessions persist? time lags multiplier/accelerator interactions expectations Why do booms and recessions end? ceilings and floors echo effects the accelerator random shocks changes in government policy
Explanations of the Business Cycle Fluctuations in aggregate supply shifts in aggregate supply curve input prices real business cycles new classical approach explanations of business cycles lie predominantly on thesupply side causes of changes in aggregate supply structural changes technological developments
Explanations of the Business Cycle real business cycles (cont.) why supply-side changes build several changes take months to complete lags in response of investment causes of turning points policy implications the concept of the business cycle fluctuations in actual output or fluctuations in potential output?
Explanations of the Business Cycle Finance and trade increasing dependence of economies on the financial system financialisation increasing interconnectedness between economies trade financial flows international business cycle
Long-term Economic Growth • Growth over the decades • long-term growth versus short-term fluctuations • convergence of rich economies • growing gap between the richest and poorest countries • an increase in potential output
Explanations of Long-term Growth Sources of economic growth increase in the quantity of factors of production
Capital and output per worker in 2013 relative to 1960 Japan Portugal Ireland Finland Greece Spain France Austria Norway Belgium Italy Denmark Sweden Neth’ds UK Luxembourg USA Switzerland Source: Based on data from AMECO database, European Commission Note: 2013 figures are forecasts
Explanations of Long-term Growth Sources of economic growth increase in the quantity of factors of production increase in the productivity of factors
(a) Productivity in selected economies relative to the UK(GDP per hour worked) Source: Based on data in International Comparisons of Productivity (National Statistics, 2012)
(c) Productivity in selected economies, 2011 (UK = 100) Source: Based on data in International Comparisons of Productivity (National Statistics, 2012)
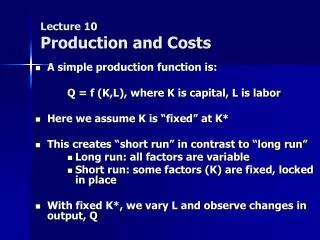
Explanations of Long-term Growth Sources of economic growth increase in the quantity of factors of production increase in the productivity of factors • Capital accumulation • a simple model of economic growth • marginal capital/output ratio • proportion of national income invested • g = i /k
Explanations of Long-term Growth Capital accumulation: neoclassical model assumption diminishing returns to capital growing proportion of replacement investment growth to a long-run equilibrium national income
Output (Y) f Y1 a Depreciation (D) Y0 Investment (I) g b I0 c D0 K0 Steady-state output Output (Y), Investment (I), Depreciation (D) Equilibrium at point g O K1 Capital stock (K)
Explanations of Long-term Growth Capital accumulation: neoclassical model assumption diminishing returns to capital growing proportion of replacement investment growth to a long-run equilibrium national income effect of an increase in the saving rate movement to a higher steady-state growth path
Effect of an increase in the rate of saving and investment Y m Y2 f Y1 D I2 n h I1 g New equilibrium Output (Y), Investment (I), Depreciation (D) Initial equilibrium K1 K2 Capital stock (K)
Explanations of Long-term Growth Capital accumulation: neoclassical model assumption diminishing returns to capital growing proportion of replacement investment growth to a long-run equilibrium national income effect of an increase in the saving rate movement to a higher steady-state growth path human capital and education
Explanations of Long-term Growth Technological progress: neoclassical model the importance of productivity the effect on output of technological progress the steady-state growth path
Effect of a technological advance Y2 Y1 p Y2 f Y1 D I2 n h I1 g Output (Y), Investment (I), Depreciation (D) K1 K2 Capital stock (K)
QWhich ONE of the following will lead to sustained economic growth over the long term? An increase in the capital stock. An increase in the rate of saving. Increased business confidence. A faster increase in productivity over the years. An increase in the size of the working population.
Explanations of Long-term Growth Technological progress: endogenous growth theory technological progress endogenously determined determinants of technological progress importance of institutional factors and policies research and development training and education incentives
Explanations of Long-term Growth Technological progress: endogenous growth theory (cont.) simple model of technological progress I = In + Ic economic growth a positive function of ratio In/Ic and of ΔY/In policy implications structural and institutional factors role of government
QAccording to endogenous growth theory: increases in aggregate supply depend on increases in aggregate demand. the rate of technological progress depends purely on developments in science and engineering which, in turn, depend on random inventions and discoveries. economic growth can only be a temporary phenomenon caused by ‘one-off’ discoveries. a faster rate of economic growth is likely to lead to a lower rate of technological progress. the rate of technological progress and diffusion can be increased by appropriate incentives and government policies.
The end… (kind of!) Any Questions?