Download

1 / 10
100 likes | 160 Views
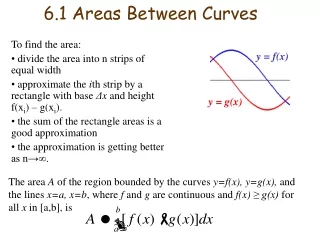
Finding Approximate Areas Under Curves. The Area of a Trapezium. Area= 1 / 2 (a+b) x h Example a=10 b=14 h= 8 Area= 1 / 2 (10 + 14) x 8 = 96cm 2. b. a. h. y 0 y 1 y 2 y 3 y 4 y 5. The Trapezium Rule.

E N D
The Area of a Trapezium Area=1/2(a+b) x h Example a=10 b=14 h= 8 Area=1/2(10 + 14) x 8 = 96cm2 b a h
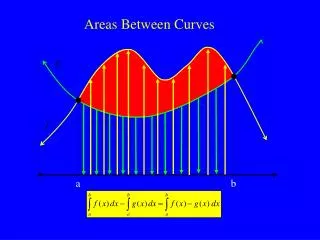
y0 y1 y2 y3 y4 y5 The Trapezium Rule This curve has a complicated equation so instead of integrating we will split the area up into a number of trapeziums each of width 0.2 and find the area of each. The y coordinates are given by y0,y1,y2,y3 etc
The Trapezium Rule • The demonstration that follows finds the area under the curve • by splitting it up into a number of trapeziums • You have to determine the rule if the number of trapeziums (intervals) is given • Applet
h y0 y1 y2 y3 y4 y5 Proving the Formula • Area of trapezium 1 = 1/2(y0+y1) x h • Area of Trapezium 2 = 1/2(y1+y2) x h • Area of Trapezium 3 = 1/2(y2+y3) x h • Area of Trapezium 4 = 1/2(y3+y4) x h h= strip width = interval width
h y0 y1 y2 y3 y4 y5 Proving the Formula • Area = 1/2h(y0 + y1+ y1+ y2 + y2…yn) • = 1/2h(y0 + 2y1+ 2y2 + 2y3…yn) • = 1/2h(y0 + 2(y1 + y2 + y3…) + yn)
0 0.2 0.4 0.6 0.8 1.0 Using the Trapezium Rule • Try this on using 5 intervals • 5 intervals from 0 to 1 means the width of each strip • is 0.2. • Type y1= • and set up the table • starting at x=0 with • steps of 0.2
Using the Table Function on Your Calculator to Determine the y Values • Enter the equation of your graph in y1 • Press Table Setup (2ndF Table) • Press the down arrow to TBLStart and input the left • hand boundary for the required area. • Press the down arrow to TBLStep and input the • width of each strip (interval) • Press Table to see the y values y0,y1,y2,y3 etc
Using the Trapezium Rule • Values from table 1/2h(y0 + 2(y1 + y2 + y3 + y4) + y5) 1/2x0.2(1+2(0.9615+0.8621+0.7353+0.6098)+0.5) 0.78374