Download
1 / 52
660 likes | 1.11k Views
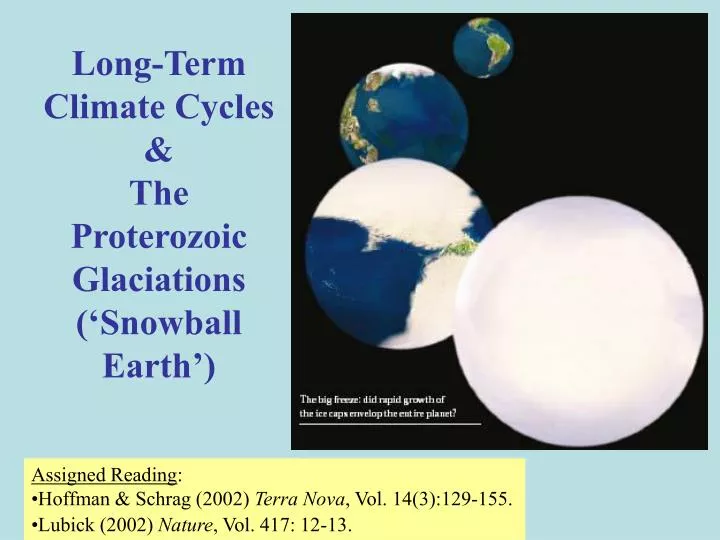
Long-Term Climate Cycles & The Proterozoic Glaciations (‘Snowball Earth’). Assigned Reading : Hoffman & Schrag (2002) Terra Nova , Vol. 14(3):129-155. Lubick (2002) Nature , Vol. 417: 12-13. Reading List #2. Climate Controls - Long & Short Timescales. Solar output (luminosity): 10 9 yr

E N D
Long-Term Climate Cycles& The Proterozoic Glaciations (‘Snowball Earth’) • Assigned Reading: • Hoffman & Schrag (2002) Terra Nova, Vol. 14(3):129-155. • Lubick (2002) Nature, Vol. 417: 12-13.
Climate Controls - Long & Short Timescales • Solar output (luminosity): 109 yr • Continental drift (tectonics): 108 yr • Orogeny (tectonics): 107 yr • Orbital geometry (Earth -Sun distance): 104-105 yr • Ocean circulation (geography, climate): 101 -103 yr • Atmospheric composition (biology, tectonics, • volcanoes): 100-105 yr
Earth’s Climate History:Mostly sunny with a 10% chance of snow • What caused these climate perturbations?
13C limestones Carbon Isotopic Excursions 800-500Ma 13C marine organic matter • What caused these massive perturbations to the carbon cycle during the late Proterozoic? 13C fractionation fraction of organic C buried Hayes et al, Chem Geol. 161, 37, 1999 Sturtian glacial(s) Marinoan/Varanger glacial(s)
Late Proterozoic Glaciations: Evidence ~4 global glaciations followed by extreme greenhouses 750-580 Ma • Harland (1964); Kirschvink (1992) • Hoffman et al. (1998) Science, v. 281: 1342-6; Hoffman & Schrag (2000) Sci. Am., Jan: 68-75. • Snowball Events: • Breakup of equatorial supercontinent 770 Ma • Enhanced weathering from increased rainfall (more land close to sea) • Drawdown atmospheric CO2 Global cooling • Runaway albedo effect when sea ice < 30° latitude • Global glaciation for ~10 Myr (avg T ~ -50°C) • Sea ice ~1000 m thick, geothermal heat flux (0.07 W/m2) keeps ocean liquid
Geologic Evidence for Glaciers • Tillites: Packed pebbles, sand & clay. Remnants of moraines • Glacial Striations: Scratches from rocks dragged by moving ice • Dropstones: Rocks transported by icebergs and dropped into finely laminated sediment (IRD). Kump et al. (1999)
Glacial sediments – poorly sorted, angular clasts including dropstones – Namibia c. 750 Ma
Neo-proterozoic Glacial Deposits From Norway, Mauritania, NW Canada, Namibia. • Glacial striations • Dropstones Hoffman & Schrag (2002) Terra Nova, Vol. 14(3):129-155.
Equatorial Continents? Hoffman & Schrag (2000) • Harland & Rudwick (1964) identified glacial sediments at what looked like equatorial latitudes by paleomagnetism. • George Williams (1975) identified low a latitude glacial sequence in S. Australia & attributed to episode of extreme obliquity (tilt).
Determining Paleolatitude from Remnant Magnetism • Paleomagnetism: latitude of formation of rock • Natural Remnant Magnetism (NRM): inclination varies with “magnetic” latitude • -vertical @ magn poles • -horz. @ magn equator (many Neoprot glac deposits) • Magnetic polar drift averages out on T~10 ky Image from P. Hoffman
Paleolatitude from Paleomagnetism Hoffman & Schrag (2002) Terra Nova, Vol. 14(3):129-155.
How to explain glaciers on all continents when those continents appear to have been close to the equator?
High Obliquity HypothesisWilliams (1975) • Earth’s tilt (obliquity) controls seasonality • At high tilt angles (> 54°) the poles receive more mean annual solar radiation than the tropics (sun constantly overhead in summer)! • Glaciers may be able to form at low latitudes • Problems: • Even the tropics get quite warm at the equinoxes • Moon stabilizes obliquity • Would need v. large impact to destabilize; moon orbit doesn’t support this Image from P. Hoffman
Snowball Earth Hypothesis ~4 global glaciations followed by extreme greenhouses 750-580 Ma • Harland (1964); Kirschvink (1992) • Hoffman et al. (1998) Science, v. 281: 1342-6; Hoffman & Schrag (2000) Sci. Am., Jan: 68-75. • Snowball Events: • Breakup of equatorial supercontinent 770 Ma • Enhanced weathering from increased rainfall (more land close to sea) • Drawdown atmospheric CO2 Global cooling • Runaway albedo effect when sea ice < 30° latitude • Global glaciation for ~10 Myr (avg T ~ -50°C) • Sea ice ~1000 m thick, geothermal heat flux (0.07 W/m2) keeps ocean liquid Lubick (2002)
Prologue to Snowball • Breakup of equatorial supercontinent • Enhanced weathering from increased rainfall (more land close to sea) • Drawdown atmospheric CO2 Global cooling Hoffman & Schrag (2000)
Deep Freeze • Global cooling causes sea ice margin to move equatorward • Runaway albedo effect when sea ice <30° latitude • Entire ocean possibly covered with ice Hoffman & Schrag (2000)
(5) Runaway Albedo Feedback Eq. continents, incr. weathering, lowers CO2, slow cooling, equatorward movement of ice. Runaway albedo Weathering shuts down Slow buildup of CO2 from volcanoes Rapid decay of ice in 102 yr. High Ts from enhanced H2O-T feedback. Slow CO2 drawdown from weathering (1) (4) (2) (3) Image from P. Hoffman
Snowball? • Global glaciation for ~10 Myr (avg T ~ -50°C) • Sea ice ~1000 m thick, geothermal heat flux (0.07 W/m2) keeps ocean liquid Hoffman & Schrag (2000)
Evidence cited for Snowball • Stratigraphy: globally-dispersed glacial deposits. • Carbon isotopes: negative 13C excursions through glacial sections (inorganic 13C reaches ~ -5 to -7‰). Little or no biological productivity (no light). • Banded iron formations w/ice-rafted debris (IRD): only BIFs after 1.7 Ga. Anoxic seawater covered by ice. • Cambrian explosion: Rapid diversification of multicellular life 575-525 Ma expected to result from long periods of isolation and extreme environments (genetic "bottleneck and flush").
Carbon Isotopic Evidence for Snowball d13C values of -5‰ (mantle value) consistent with “dead” ice-covered ocean Image from P. Hoffman
Carbon Isotope Fractionation • As fraction of carbon buried approaches zero, d13C of CaCO3 approaches mantle (input) value Image from P. Hoffman
13C limestones Extreme Carbon Isotopic Excursions 800-500Ma Require Massive Perturbation of Global carbon Cycle 13C marine organic matter 13C fractionation fraction of organic C buried Hayes et al., Chem Geol. 161, 37, 1999 Sturtian glacial(s) Marinoan/Varanger glacial(s)
The Return of Banded Iron Formations • After a ~1 Gyr absence, BIFs return to the geologic record • Implies anoxic ocean • Consistent with ice-covered ocean Image from P. Hoffman
BIF + Dropstone = Ice-covered, anoxic ocean? McKenzie Mtns., Western Canada Image from P. Hoffman
Metazoan Explosion: Response to genetic bottlenecks & flushes? Image from P. Hoffman
Breaking out of the Snowball • Volcanic outgassing of CO2 over ~106 yr may have increased greenhouse effect sufficiently to melt back the ice. Lubick (2002) Nature, Vol. 417: 12-13.
Bring on the Heat: Hothouse follows Snowball? • Hothouse Events • Slow CO2 buildup to ~350 PAL from volcanoes • Tropical ice melts: albedo feedback decreases, water vapor feedback increases • Global T reaches ~ +50°C in 102 yr • High T & rainfall enhance weathering • Weathering products + CO2 = carbonate precipitation in warm water
One Complete Snowball-Hothouse Episode Image from P. Hoffman
The Geochemical Carbon Cycle Image from P. Hoffman
Enhanced Weathering of Rocks Results in Precipitation of Minerals in Ocean • High T & CO2 cause increase in weathering rate of continents • Products of weathering carried to ocean by rivers • Precipitated as CaCO3 and SiO2 minerals in ocean
Geologic Evidence for Hothouse Aftermath:“Cap Carbonates”Thick sequences of inorganically precipitated CaCO3 overly Neoproterozoic glacial deposits globally.
Neo-proterozoic Cap Carbonates-1 • Thick sequences of inorganically precipitated carbonate minerals are found over Late Proterozoic glacial deposits. • Consistent with massive flux of weathering products to ocean in snowball aftermath. Hoffman & Schrag (2002) Terra Nova, Vol. 14(3):129-155.
Neoprot. Cap Carbonates: 2 • Ripples, storm waves • Aragonite crystal fans Hoffman & Schrag (2002) Terra Nova, Vol. 14(3):129-155.
Aragonite Fan in Namibia • Carbonate fans form when CaCO3 is rapidly precipitated from water. Image from P. Hoffman
Geologic & Isotopic Change Associated with Snowball Event:Glacial Deposit Overlain by Cap Carbonate in Namibia (~700 Ma) Hoffman & Schrag (2002) Terra Nova, Vol. 14(3):129-155.
Summary of Snowball-Hothouse Sequence Note: T estimated from E balance model Hoffman & Schrag (2002) Terra Nova, Vol. 14(3):129-155.
Evidence for Snowball / Hothouse • Stratigraphy: globally-dispersed glacial deposits overlain by thick sequences of inorganic (cap) carbonates. • Carbon isotopes: negative 13C excursions through glacial sections (13C reaches ~ -5 to -7‰). Little or no biological productivity (no light). Remain low through most of cap carbonate deposition. • Banded iron formations w/IRD: only BIFs after 1.7 Ga. Anoxic seawater covered by ice. • Cambrian explosion: Rapid diversification of multicellular life 575-525 Ma expected to result from long periods of isolation and extreme environments (genetic "bottleneck and flush").
How Long Did it Last? • Big open question! Recent work by Sam Bowring (MIT) suggests glacial episode lasted < 1 Myr • Glacial episodes probably lasted < 1 Myr • Cap carbonates likely deposited within 103-104 yr Image from P. Hoffman
What kept this from happening after ~580 Ma? • Higher solar luminosity (~5% increase) • Less landmass near equator = lower weathering rates (?) • John Edmond: weathering rates limited by abundance of fresh rock, not temperature. • Increased bioturbation (eukaryote diversity following re-oxygenation of ocean): Less C accumulation in sediments sequesters less atmospheric CO2, offsetting lower weathering rates (from higher-latitude continents). • lower iron and phosphorus concentrations in better-oxygenated Phanerozoic ocean [Fe(II) is soluble; Fe(III) is less so]: Decreased 1° production = Decreased CO2 drawdown. What we would like to know: CO2 concentrations through snowball/hothouse cycle.
Potential Problems with the ‘Snowball Earth hypothesis’ • Ocean/atmosphere climate models cannot seem to keep entire ocean covered with ice. • No evidence for lower sea level. • Weathering reactions are slow….. Maybe too slow to be the source of cap carbonates. Lubick (2002) Nature, Vol. 417: 12-13.
Alternate Cause for Cap Carbonate Deposition & 13C Depletions:Gas Hydrate Destabilization Kennedy et al. (2001) Geology Vol. 29(5): 443-446. • CaCO3 precipitation does not require increased weathering flux of minerals. • Can be caused by increased seawater alkalinity resulting from CH4 consumption by sulphate-reducing bacteria. • CH4 + SO4= -> HCO3- + HS- + H2O
Structures in Cap Carbonates May Result from Gas Release • Gas Hydrate = [H2O + hydrocarbon (CH4)] ice • CH4 from biogenic + thermogenic decomposition of deeply buried Corg • Biogenic CH4 has very low d13C (-60 to-90‰) • Sequestered as hydrate in permafrost (> 150 m) & along continental margins (> 300 m) • Destabilized by increased temperature • CH4 released from flooded permafrost during deglaciation Kennedy et al. (2001) Geology Vol. 29(5): 443-446.
Gas Hydrate Stability Smith et al. (2001) Geophys. Res. Lett., Vol.28(11): 2217-2220.
Rather than increased weathering flux of cations & HCO3- to ocean causing CaCO3 precipitation, decreased seawater alkalinity could have caused CaCO3 precipitation CH4 consumption by SO42- reducers @ seafloor & in flooded permafrost Drives SCO2 (H2CO3 + HCO3- + CO32-) toward CO32-, causing CaCO3 to precipitate out of seawater CH4-derived CaCO3 has low d13C
CH4 consumption by sulphate reducers is observed at methane seeps in modern ocean, & CaCO3 precipitates there as a result • SO42- reducers produce highly 13C depleted HCO3- which goes into ocean/atmosphere