Download
1 / 84
850 likes | 978 Views
TOOLKIT FOR Hazardous Materials Transportation Education.

E N D
This work is sponsored by the U. S. Department of Transportation Pipeline and Hazardous Materials Safety Administration (PHMSA). It was conducted through the Hazardous Materials Cooperative Research Program (HMCRP), which is administered by the Transportation Research Board of the National Academies. • Prepared by • 3 Sigma Consultants, LLC • 909 Edenbridge Way, Nashville, TN 37215 Module 2: Hazmat Transportation Logistics
Learning Outcomes At the end of this module students will be able to: • Describe the extent of freight transportation infrastructure and activity in the U.S. • Describe the contribution and characteristics of hazardous materials transport as part of the freight transportation system. • Identify the key stakeholders in the supply chain process and their roles and responsibilities. • Explain the operational issues and economic considerations associated with the transport of hazardous materials.
Topics • U.S. freight transportation infrastructure, vehicles and equipment • Hazmat shipment classifications, modes and commodity flows • Hazmat shipment supply chain process maps • Management and operational issues
U.S. Freight Transportation Infrastructure • Roads • Over 4 million miles of public roads • 164,000 miles of roads comprising the National Highway System, including over 47,000 miles of Interstates • Rail • Over 250,000 miles of track, including yards, sidings and multiple main tracks • Nearly 95,000 miles of Class I railroad track • Waterway • Over 13,000 miles of inland waterways, including rivers and Great Lakes • Nearly 300 major commercial ports • Pipeline • Roughly 1.7 million miles of oil and gas pipelines • Air • Over 13,000 airports Sources: FHWA Freight Facts and Figures 2011, North American Transportation Statistics Database
U.S. Freight Transportation Vehicles & Equipment • Nearly 11 million commercial freight trucks • 24,000 freight locomotives and over 1.3 million rail cars • 40,000 freight vessels – 9,000 self-propelled and 31,000 barges • Over 18,000 commercial aircraft Sources: FHWA Freight Facts and Figures 2011, North American Transportation Statistics Database
Economic Characteristics of Transportation and Warehousing in Freight-Dominated Modes
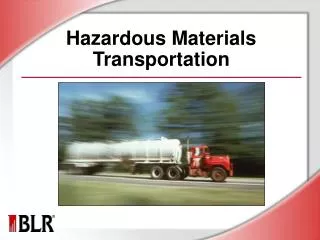
Freight Transportation Modes • Highway (Truck) • Private and for-hire • Bulk and less-than-truckload (LTL) shipments • LTL carriers consolidate many freight packages into a single larger shipment to improve shipper and/or customer efficiency • Rail • Class 1 (major carriers) • Class 2 (regional and short lines) • Class 3 (terminal – switching) • Marine (Water) • Brown water (inland) • Green water (coastal) • Blue water (ocean-going) • Pipeline • Air (with truck) • Intermodal
Various Types of Hazmat Packaging Drums Boxes Cylinders Special Containers Tanks
Tonnage on Highways, Railroads and Inland Waterways: 2007 Each surface mode is characterized by major freight corridors.
National Network for Conventional Combination Trucks: 2010 One-fourth of distance traveled by all traffic is on interstates, yet nearly one-half of combination truck vehicle miles are on these roads. 20
Top 25 Water Ports by Tonnage: 2009 The top 25 water ports handle roughly two-thirds of the weight of all foreign and domestic goods moved by water. 21
Tonnage of Trailer-on-Flatcar and Container-on-Flatcar Rail Intermodal Moves: 2009 Rail intermodal transport is spread throughout the U.S. 23
Top 25 Foreign Trade Freight Gateways by Value: 2009 Top 25 foreign trade gateways by shipment value include 10 water ports, 6 land-border crossings and 9 airports.
Economic Considerations – Dry Cargo Capacity Efficiencies Among Surface Transportation Source: C. James Kruse, et. al., A Modal Comparison of Domestic Freight Transportation Effects on the General Public: 2001-2009, Prepared by the Center for Ports and Waterways, Texas Transportation Institute, Houston, Texas, 2012, p. 2. Prepared for the National Waterways Foundation. 1750 Short Tons is the standard dry bulk cargo capacity for a single barge.
Economic Considerations – Liquid Cargo Capacity Efficiencies Among Surface Transportation Source: C. James Kruse, et. al., A Modal Comparison of Domestic Freight Transportation Effects on the General Public: 2001-2009, Prepared by the Center for Ports and Waterways, Texas Transportation Institute, Houston, Texas, 2012, p. 2. Prepared for the National Waterways Foundation. 27,500 BBL is the standard liquid bulk cargo capacity for a single barge.
Economic Considerations – Fuel Efficiency Comparisons Among Surface Transportation Ton-Miles per Gallon of Fuel: 2009 Source: C. James Kruse, et. al., A Modal Comparison of Domestic Freight Transportation Effects on the General Public: 2001-2009, Prepared by the Center for Ports and Waterways, Texas Transportation Institute, Houston, Texas, 2012, p. 5. Prepared for the National Waterways Foundation.
Environmental Considerations – Greenhouse Gas Emission Comparison Among Surface Transportation Metric Tons of GHG per Million Ton-Miles (2005 & 2009) Source: C. James Kruse, et. al., A Modal Comparison of Domestic Freight Transportation Effects on the General Public: 2001-2009, Prepared by the Center for Ports and Waterways, Texas Transportation Institute, Houston, Texas, 2012, p. 5. Prepared for the National Waterways Foundation. GHG is Greenhouse Gas Emissions.
SmartWay: Reducing Transportation Emissions • An Environmental Protection Agency (EPA) initiative that reduces transportation related emissions by creating incentives to improve efficiency. • Freight carriers and shippers commit to benchmark operations, track fuel consumption and improve performance annually. • Program includes testing, verification and designation to help identify equipment, technologies and strategies that save fuel and lower emissions. • Provides grants to make investing in fuel-saving equipment easier for freight carriers. Source: http://www.epa.gov/smartway/basic-info/index.htm 29
PHMSA Hazmat Classification System Class 3: Flammable & Combustible Liquid Class 4: Flammable Solid • 4.1 Flammable solid • 4.2 Spontaneously combustible material • 4.3 Dangerous when wet material Class 5: Oxidizing Agent & Organic Peroxide • 5.1 Oxidizer • 5.2 Organic peroxide Class 6: Toxic & Infectious Substance • 6.1 Poisonous material • 6.2 Infectious substance (Etiologic agent) Class 7: Radioactive Material Class 8: Corrosive Material Class 9: Miscellaneous Hazardous Material Class 1: Explosives • 1.1 Explosives with a mass explosion hazard • 1.2 Explosives with a projection hazard • 1.3 Explosives with predominately a fire hazard • 1.4 Explosives with no significant blast hazard • 1.5 Very insensitive explosives; blasting agents • 1.6 Extremely insensitive detonating substances Class 2: Gas • 2.1 Flammable gas • 2.2 Non-flammable compressed gas • 2.3 Poisonous gas Note: Gasoline and fuel oil are considered Class 3 materials; liquefied natural gas and compressed natural gas are considered Class 2 materials.
Hazardous Material Shipment Characteristics - 2007 • Over 2.2 billion tons of hazardous materials are transported every year in the U.S., valued at over $1.4 trillion. • This corresponds to 323 trillion ton-miles of hazmat cargo moved annually. • The average trip distance of these shipments is 96 miles. • Hazmat transportation represents roughly 18% of total tons transported by freight industry and accounts for nearly 10% of the ton-miles. Source: 2007 Commodity Flow Survey. This survey is performed by the U.S. Census Bureau every five years. 2012 survey results are not yet available.
Tonnage by Mode and Shipment Type - 2007 s = Estimate does not meet publication standards because of high sampling variability or poor response quality. Source: 2007 Commodity Flow Survey. This survey is performed by the U.S. Census Bureau every five years. 2012 survey results are not yet available.
Percent Hazmat Tons Shipped by Mode - 2007 The majority of hazardous cargo by weight is moved by truck, with a significant volume of hazmat also moved by pipeline. Source: 2007 Commodity Flow Survey. This survey is performed by the U.S. Census Bureau every five years. 2012 survey results are not yet available.
Tonnage Moved by Mode and Hazard Class - 2007 (includes combustible liquids) Rail carries the most uniformly distributed mix of different classes of hazardous materials. Source: 2007 Commodity Flow Survey. This survey is performed by the U.S. Census Bureau every five years. 2012 survey results are not yet available.
Ton-Miles by Mode and Shipment Type - 2007 S = Estimate does not meet publication standards because of high sampling variability or poor response quality. Ton-mile measure not relevant for continuous flow mode of pipeline. Source: 2007 Commodity Flow Survey. This survey is performed by the U.S. Census Bureau every five years. 2012 survey results are not yet available.
Percent Hazmat Ton-Miles by Mode - 2007 Due to the movement of larger loads, longer distances, rail, water and intermodal transport become significant freight modes when ton-miles are considered. Source: 2007 Commodity Flow Survey. This survey is performed by the U.S. Census Bureau every five years. 2012 survey results are not yet available.
Average Hazmat Trip Length by Mode (Miles) - 2007 Local distribution is the dominant trip pattern for moving hazmat by truck. Source: 2007 Commodity Flow Survey. This survey is performed by the U.S. Census Bureau every five years. 2012 survey results are not yet available.
Top Hazmat Classes/Divisions Transported by Mode s = Estimate does not meet publication standards because of high sampling variability or poor response quality. Source: William Tate, et al., Evaluation of the Use of Electronic Shipping Papers for Hazardous Materials Shipments, HMCRP Report 8, Transportation Research Board, Washington DC, 2012, p. 48. Note that this source identifies Ocean as a Transport Mode. The 2007 Commodity Flow Survey identifies Water as a Transport Mode instead of Ocean, reflecting shipments on the inland water system as well as ocean movements as well.
Overview of Modes and HM Shipments Source: William Tate, et al., Evaluation of the Use of Electronic Shipping Papers for Hazardous Materials Shipments, HMCRP Report 8, Transportation Research Board, Washington DC, 2012. The 2007 Commodity Flow Survey identifies Water as a Transport Mode instead of Ocean (Marine), reflecting shipments on the inland water system as well as ocean movements as well.
Hazmat Shipments by State of Origin - 2007 Source: 2007 Commodity Flow Survey. This survey is performed by the U.S. Census Bureau every five years. 2012 survey results are not yet available.
Hazmat Shipments (Tons) by State of Origin - 2007 Source: 2007 Commodity Flow Survey. This survey is performed by the U.S. Census Bureau every five years. 2012 survey results are not yet available.
Hazmat Shipments by State of Destination - 2007 Source: 2007 Commodity Flow Survey. This survey is performed by the U.S. Census Bureau every five years. 2012 survey results are not yet available.
Hazmat Shipment Characteristics by Selected Commodities - 2007 Source: 2007 Commodity Flow Survey. This survey is performed by the U.S. Census Bureau every five years. 2012 survey results are not yet available.
Class 1 HM (Explosive) Shipments by Mode - 2007 s = Estimate does not meet publication standards because of high sampling variability or poor response quality. Source: 2007 Commodity Flow Survey. This survey is performed by the U.S. Census Bureau every five years. 2012 survey results are not yet available.
Class 2 HM (Gas) Shipments by Mode - 2007 s = Estimate does not meet publication standards because of high sampling variability or poor response quality. Source: 2007 Commodity Flow Survey. This survey is performed by the U.S. Census Bureau every five years. 2012 survey results are not yet available.
Class 3 HM (Flammable and Combustible Liquid) Shipments by Mode - 2007 s = Estimate does not meet publication standards because of high sampling variability or poor response quality. Source: 2007 Commodity Flow Survey. This survey is performed by the U.S. Census Bureau every five years. 2012 survey results are not yet available.
Class 4 HM (Flammable Solid) Shipments by Mode - 2007 Source: 2007 Commodity Flow Survey. This survey is performed by the U.S. Census Bureau every five years. 2012 survey results are not yet available.
Class 5 HM (Oxidizing Agent & Organic Peroxide) Shipments by Mode - 2007 Source: 2007 Commodity Flow Survey. This survey is performed by the U.S. Census Bureau every five years. 2012 survey results are not yet available.
Class 6 HM (Toxic & Infectious Substances) Shipments by Mode - 2007 s = Estimate does not meet publication standards because of high sampling variability or poor response quality. Source: 2007 Commodity Flow Survey. This survey is performed by the U.S. Census Bureau every five years. 2012 survey results are not yet available.
Class 7 HM (Radioactive Material) Shipments by Mode - 2007 Source: 2007 Commodity Flow Survey. This survey is performed by the U.S. Census Bureau every five years. 2012 survey results are not yet available.