Download
1 / 1
10 likes | 139 Views
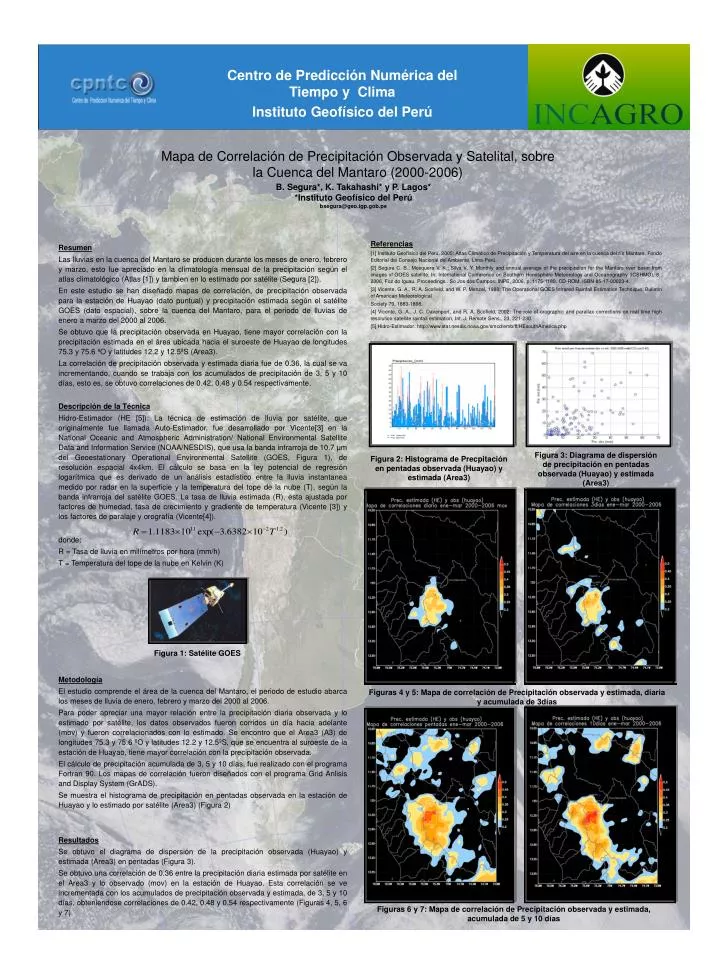
Mapa de Correlación de Precipitación Observada y Satelital, sobre la Cuenca del Mantaro (2000-2006). B. Segura * , K. Takahashi* y P. Lagos * * Instituto Geofísico del Perú bsegura@geo.igp.gob.pe. Figura 2: Histograma de Precpitación en pentadas observada (Huayao) y estimada (Area3).

E N D
Mapa de Correlación de Precipitación Observada y Satelital, sobre la Cuenca del Mantaro (2000-2006) B. Segura*, K. Takahashi* y P. Lagos**Instituto Geofísico del Perú bsegura@geo.igp.gob.pe Figura 2: Histograma de Precpitación en pentadas observada (Huayao) y estimada (Area3) Figura 3: Diagrama de dispersión de precipitación en pentadas observada (Huayao) y estimada (Area3) Figura 1: Satélite GOES Figuras 4 y 5: Mapa de correlación de Precipitación observada y estimada, diaria y acumulada de 3días Figuras 6 y 7: Mapa de correlación de Precipitación observada y estimada, acumulada de 5 y 10 días