Download
1 / 78
780 likes | 891 Views
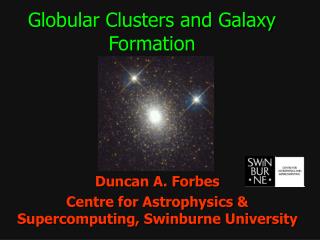
Constraining the Helium Abundance in Globular Clusters. Márcio Catelan Departamento de Astronomía y Astrofísica Pontificia Universidad Católica de Chile. Bologna , 06/18/2009. Globular star clusters: laboratories of low-mass stellar evolution. AGB. RGB. HB. TO. MS. WD.

E N D
ConstrainingtheHeliumAbundancein Globular Clusters Márcio CatelanDepartamento de Astronomía y Astrofísica Pontificia Universidad Católica de Chile Bologna, 06/18/2009
Globular star clusters: laboratories of low-mass stellar evolution AGB RGB HB TO MS WD Harris (2003, in A Decade of Hubble Space Telescope Science, p. 78)
An overview of the evolution of a low-mass star type II Cepheids end of isothermal collapse phase start, main accretion phase canonical pre-MS phase ZAMS H exhaustion (TO point) first dredge-up RGB “bump” He “flash” ZAHB TAHB RR Lyraestars Catelan 2007, AIP Conf. Proc., Vol. 930, p. 39 (astro-ph/0703724)
Yes, many GC stars do pulsate! Example: variable stars in globular cluster M3. variable stars in the globular cluster M3 (by K. Stanek)
Structure of a 0.8 M ZAMS star Iben (1971, PASP, 83, 697)
Why does a star evolve off the ZAMS? • As the PP chain converts H into He, the mean molecular weight of the core changes: • But the gas pressure is given by: • Therefore, unless r and/or T increase, the central pressure will drop and become insufficient to support the star!
So… what really happens? • To maintain equilibrium, the core of the star does contract… • As a consequence of the virial theorem, half of the gravitational energy released during the contraction goes to increase the thermal energy (hence temperature) of the gas, and half is radiated away: • The PP chain nuclear reaction rate goes as: • Hence the increase in r and T more than compensates for the decrease in X, and the luminosity of the star increases slowly, along with its radius and effective temperature!
Temp-Density Evolution ZAMS Pre-MS evolution MS evolution (slow…) Current position of the Sun, after 4.5 Gyr of MS evolution… Adapted from Sackmann et al. (1993, ApJ, 418, 457)
L-Te Evolution Pre-MS evolution MS evolution(slow…) Current position of the Sun, after 4.5 Gyr of MS evolution… ZAMS Adapted from Sackmann et al. (1993, ApJ, 418, 457)
Competition between PP and CNO reactions In lower-mass MS stars, the central temperature is lower, so the PP chain dominates; H-burning via the CNO process becomes most important during shell burning phases.
Evolution up to the RGB tip summarized Weak H-burning Convection Strong H-burning Age in 109 yr Thomas (1967, ZfA, 67, 420)
RGB core Iben (1971, PASP, 83, 697)
RGB envelope Iben (1971, PASP, 83, 697)
He-flash & “looping” The evolution during the secondary flashes ZAHB Mengel & Sweigart (1981, in IAU Colloq. 68, p. 277)
He-flash & convection Internal evolution Mengel & Sweigart (1981, in IAU Colloq. 68, p. 277)
Core of HB Star Iben (1971, PASP, 83, 697)
Envelope of HB Star Iben (1971, PASP, 83, 697)
ZAHB The ZAHB as a function of mass… Adapted from Dorman et al. (1993, ApJ, 419, 596)
Direct determination: Unfortunately, most GC stars are too cool for direct He abundance measurements…
Direct determination: M13 …and most of those GC stars that are sufficiently hot have their atmospheres strongly affected by diffusion effects! adapted from Behr et al. (1999, ApJ, 517, L135) adapted from Catelan (2009, Ap&SS, 320, 261)
Direct determination: …and most of those GC stars that are sufficiently hot have their atmospheres strongly affected by diffusion effects! Behr (2002, ASP Conf. Ser., Vol. 296, p. 275) adapted from Catelan (2009, Ap&SS, 320, 261)
Direct determination: …and most of those GC stars that are sufficiently hot have their atmospheres strongly affected by diffusion effects! Moehler et al. (2004, A&A, 415, 313) adapted from Catelan (2009, Ap&SS, 320, 261)
Direct determination: Still, there is a narrow window at the blue HB where one can find stars suitable for reliable He abundance determinations! Villanova et al. (2009, A&A, 499, 755) adapted from Catelan (2009, Ap&SS, 320, 261)
Direct determination: Still, there is a narrow window at the blue HB where one can find stars suitable for reliable He abundance determinations! Villanova et al. (2009, A&A, 499, 755)
On the other hand, the detailed CMD loci are expected to depend on the helium abundance Y: Therefore, one should be able to constrain the He abundance in globular cluster stars by properly studying their CMDs. D’Antona et al. (2002, A&A, 395, 69)
Several authors have recently suggested that multiple populations with widely varying levels of He abundance may be present in GCs. Piotto et al. (2005, ApJ, 621, 777) Piotto et al. (2007, ApJ, 661, L53)
Several authors have recently suggested that multiple populations with widely varying levels of He abundance may be present in GCs. Lee et al. (2005, ApJ, 621, L57)
Indeed, such helium enhancements are now claimed to be quite commonplace among globulars! We need to apply the techniques at our disposal to constrain this scenario, which has far-reaching consequences! adapted from D’Antona & Caloi (2008, MNRAS, 390, 693)
Techniques to Constrain the He Abundancein Globular Clusters
Iben’s R-method: The number ratio (“R”) between HB stars and RGB stars brighter than the HB is a strong function of Y. adapted from Iben (1968, Nature, 220, 143)
Iben’s R-method: The number ratio (“R”) between HB stars and RGB stars brighter than the HB is a strong function of Y. Buzzoni et al. (1983, A&A, 128, 94) adapted from Iben & Rood (1969, Nature, 223, 993)
Iben’s R-method: Salaris et al. (2004, A&A, 420, 911)
Caputo et al.’s D-method: D MS position at (B-V)0 = 0.7, or (V-I)0 ~ 0.85 The magnitude difference (“D”) between HB stars and MS stars (at a given color) is a strong function of Y. adapted from Caputo et al. (1983, A&A, 123, 135)
Caputo et al.’s D-method: The magnitude difference (“D”) between HB stars and MS stars is a strong function of Y. adapted from Sandquist (2000, MNRAS, 313, 571)
Caputo et al.’s D-method: The magnitude difference (“D”) between HB stars and MS stars is a strong function of Y. adapted from Sandquist (2000, MNRAS, 313, 571)
Caputo & Castellani’s A-method: The period-mean density relation of stellar pulsation implies (van Albada & Baker 1971, ApJ, 169, 311): Defining The quantity A can thus be derived based on P and Teff measurements only. The RR Lyrae “mass-to-light ratio” A is a strong function of Y. adapted from Caputo & Castellani (1985, Ap&SS, 38, 39)
Caputo & Castellani’s A-method: Unfortunately, there are strong HB type effects that are very difficult to reliably model. In addition, the clusters with the bluer HB types often have exceedingly few RR Lyrae stars, thus giving rise to strong statistical fluctuations. The RR Lyrae “mass-to-light ratio” A is a strong function of Y. Caputo & De Santis (1992, ApJ, 401, 260)
Caputo & Castellani’s A-method: Unfortunately, there are strong HB type effects that are very difficult to reliably model. In addition, the clusters with the bluer HB types often have exceedingly few RR Lyrae stars, thus giving rise to strong statistical fluctuations. The approach adopted by Sandquist was accordingly to limit the sample to GCs with large numbers of ab-type RR Lyrae, and to perform differential comparisons within each Oosterhoff group. The RR Lyrae “mass-to-light ratio” A is a strong function of Y. Sandquist (2000, MNRAS, 313, 571)
Caputo & Castellani’s A-method: Unfortunately, there are strong HB type effects that are very difficult to reliably model. In addition, the clusters with the bluer HB types often have exceedingly few RR Lyrae stars, thus giving rise to strong statistical fluctuations. The approach adopted by Sandquist was accordingly to limit the sample to GCs with large numbers of ab-type RR Lyrae, and to perform differential comparisons within each Oosterhoff group. adapted from Sandquist (2000, MNRAS, 313, 571)
Caputo & Castellani’s A-method: Application to the case of wCen: If He enhancement is the explanation for its MS anomalies, wCen must have at least two metal-intermediate populations with similar [Fe/H] but different Y! Piotto et al. (2005, ApJ, 621, 777) Sollima et al. (2006, ApJ, 640, L43)
Caputo & Castellani’s A-method: Likewise, in the case of NGC 1851 (“period shift analysis”, as opposed to A-method proper): Lee et al. (2009, ApJ, 695, L78)
Other He indicators: i) The RGB bump adapted from Iben (1968, Nature, 220, 143)
Other He indicators: i) The RGB bump Bono et al. (2001, ApJ, 546, L109)
Other He indicators: i) The RGB bump adapted from Riello et al. (2003, A&A, 410, 553)
Other He indicators: i) The RGB bump adapted from Bono et al. (2001, ApJ, 546, L109)
Other He indicators: ii) Post-EHB stars M32 Brown et al. (2008, ApJ, 683, 319)