Download
1 / 37
440 likes | 987 Views
Social Stratification. A System by Which a Society Ranks Categories of People in a Hierarchy. Basic Principles. A trait of society not individual differences, but society’s structure Persists over generations Social mobility happens slowly Universal but variable

E N D
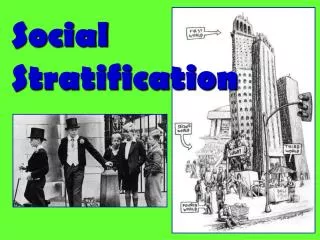
Social Stratification A System by Which a Society Ranks Categories of People in a Hierarchy
Basic Principles • A trait of society • not individual differences, but society’s structure • Persists over generations • Social mobility happens slowly • Universal but variable • While universal, it varies in type • Involves not just inequality but beliefs • Ideologies justify existence of social stratification
Ideologies justify existence of social stratification • Embedded in all social structures/processes • May be more or less “hegemony” • Conservative/liberal debate not about the sanctity of stratification but about access to mobility
The Caste System • Social stratification based on ascription • Birth determines social position in four distinct ways • Occupation • Marriage within caste • Social life is restricted to “own kind” • Belief systems are often tied to religious dogma • Caste system is illegal in US, but elements survive
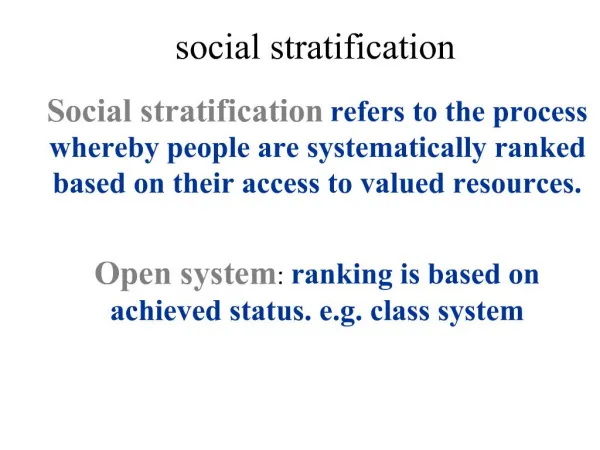
Class Systems • Social stratification based on both birth and individual achievement • Social mobility for people with education and skills • All people gain equal standing before the law • Work involves some personal choice • Meritocracy: based on personal merit • Status consistency
Stratification Changes Caste to Meritocracy • The United Kingdom (from feudal estates) • The three estates: nobility, clergy, commoners • Japan • Nobility, samurai, commoners, burakumin (outcasts) • Former Soviet Union • Feudal estate system • Russian revolution “classless society” • Perestroika “restructuring”
Figure 8-1 (p. 193)Economic Inequality in Selected Countries
Ideology • Cultural beliefs that justify stratification • Plato: all cultures consider inequality “fair” • Marx: Capitalist societies keep wealth and power for a few • Spencer: Societies “survival of the fittest”
The Davis-Moore Thesis • Social stratification has beneficial consequences for the operation of a society • The greater the importance of a position, the more rewards a society attaches to it • Egalitarian societies offer little incentive for people to try their best • Critical evaluation
Karl Marx: Class and Conflict • Most people have one of two relationships with the means of production • Own productive property “bourgeoisie” • Work for others “proletariat” • Capitalism creates great inequality in power and wealth • This oppression would drive the working majority to organize and overthrow the capitalism
Why No Marxist Revolution? • Fragmentation of the capitalist class • Higher standard of living • More worker organizations • More extensive legal protections
Was Marx Right? • Wealth still remains highly concentrated • 40% of private property by 1% of population • White-collar jobs offer little in • Income, security or satisfaction (outsourcing) • Workers benefits came from struggle • Conflict and distrust still remain as obstacles between management and workers • Little has been won recently • Law still protects private property of rich
Max Weber: Class, Status, and Power • Socioeconomic status (SES) • Composite ranking based on various dimensions of social inequality • Class position • Viewed “classes” as a continuum from high to low • Status • Power • Inequality in history
Stratification and Technology:a Global Perspective • Hunting and gathering societies • Horticultural, pastoral, and agrarian societies • Industrial societies • The Kuznet’s curve • Greater technological sophistication generally is accompanied by more pronounced social stratification
Figure 8-2 (p. 199)Social Stratification and Technological Development: The Kuznets Curve
“Ideal” Middle Class Society • Everyone stands equal under the law • We celebrate individuality • We interact mostly with people like ourselves • Most do not know “superrich” or or those in “poverty” • The U.S. Is an affluent society • Belief that everyone is financially comfortable • Socioeconomic status (SES) reflects money (income, wealth & power), occupational prestige and schooling
Figure 8-3 (p. 201)Distribution of Income and Wealth in the United States
Dimensions of Class • Income • Occupational wages and earnings from investments • Wealth • The total value of money and other assets, minus any debt • Social power • The ability to control, even in the face of resistance • Occupational prestige • Job-related status • Schooling • Key to better career opportunities
Social Stratification & Birth • Ancestry • Born to privilege or poverty makes a big difference • Gender • More poor families are headed by women • Race and ethnicity • Disparity still exist when comparing majority and minority groups on social and financial variables • Religion • Members of protestant denominations (Episcopalians and Presbyterians) are identified as the most affluent
Figure 8-4 (p. 205)Average Wealth for Whites and Nonwhite or Hispanic Minorities, 1998
Social Classes • The upper class • 5 % of the population • The middle class • 40-45% of the population • The working class • 33% of the population • The lower class • The remaining 20% of people
Upper Class • The upper-uppers • The blue bloods • Membership almost always based on ascription • They have “old money” • They are set apart by the amount of wealth their families control • Much time devoted to community activities • The lower-uppers • The working rich people • The “new rich” by “old money” standards • Can still find themselves excluded from certain organizations and clubs
Middle Class • More racial and ethnic diversity • Upper-middles • $80,000 to $160,000 yearly income • Education is important • High occupational prestige • Involvement in local politics • Average-middles • Less prestige in occupation • Few white collar, or high-skilled blue collar jobs • Income provides modest security • 50% kids attend state-sponsored colleges
Working Class • Marxist “industrial proletariat” • $25,000 to $40,000 annual income • “Blue-collar” routine jobs with less satisfaction • Half own their own homes • Fewer children go to college (only one-third) • Vulnerable to financial problems caused by unemployment or illness
Lower Class • 31.1 million Americans classified as poor in 2000 • Others are “working poor” minimum wage jobs • Half complete high school, one in four attend college • Own homes in less desirable inner city neighborhoods or rural south
The Difference Class Makes • Health • Amount and type of health care • Cultural values • Vary with position • Politics • Conservative or liberal • Degree of involvement • Family and gender • Type of parental involvement • Socialization practices • Relationships and responsibilities
Social Mobility • Upward • College degree or higher-paying job • Downward • Drop out of school, losing a job or divorce • Structural social mobility • Changes in society or national economic trends • Intergenerational mobility • Change in social position during one person’s lifetime • Intergenerational mobility • Upward or downward movement that takes place across generations within a family
Myth Versus Reality • Among men, mobility has been fairly high • Long-term trend has been upward • Intergenerational mobility is small, not dramatic • Social mobility since the 1970’s has been uneven • Income, race, ethnicity and gender effects social mobility
Figure 8-5 (p. 209)Mean Income, U.S. Families, 1980-2000 (in 2000 dollars, adjusted for inflation)
The American Dream • Earnings have stalled for many workers • Many persons need to hold more than one job • More jobs offer little income • Young people are remaining at (and returning to) home • Middle-class slide • Median income doubled between 1950-1973; Grown only 25% since
Perfectly Legal (By DAVID CAY JOHNSTON (2003) • 1977: the richest 1 percent had as much to spend after taxes as the bottom 49 million. • 1999: 1 percent-about 2.7 millionpeople-had as much as the bottom 100 million. • 2000:the top 13,400 households averaged $24 million or 560 times the average. • 1970: the top group had about 100 times the average.
Perfectly Legal 2 • For eachadditional dollar going to one in the bottom 99 percent of Americans the richest 1/100% averaged $7,500. • 13,400 top households had slightly more income than the 96 million poorest Americans. • $600 per year for upper mc (90k) • $4,600 annually at the ninety-ninth rung • $672,000 annual gain for top 1/100%
Global Economy and U.S. Class Structure Global economic expansion • Jobs changed from manufacturing to service work • Creates upward mobility for educated people • Investments for those with money • “Downsizing” in companies effects “average” workers
Extent of Poverty • Poverty • Relative (in relation to others) • Absolute (life threatening) • Poverty threshold (line) • Three times the income needed to purchase a nutritionally adequate diet • Adjusted for family size and cost of living • Extent of poverty in America • 11.3% (31.1 million) are so classified • Another 12.3 million are near poor at 125% of poverty threshold
Demographics of Poverty • Age • In 2000, 16.2% of all children were poor, contributing to high infant mortality rate • Race and ethnicity • Two-thirds of all poor are white • In 2000, 22.1% of all African Americans and 21.2% of all Latinos lived in poverty, in relation to population numbers they are three times as likely to be poor • Gender • The feminization of poverty: • 60% of poor are women • Rise in households headed by single women
Explaining Poverty • Blame the poor • The poor are mostly responsible for their own poverty • A culture of poverty: produces a self-perpetuating cycle of poverty • 1996, time limits of 2 years and total of 5 • Blame society • Little opportunity for work • William Julius Wilson proposes • Government hire people (WPA) • Improve schools, transportation and daycare
Homeless • No precise count • How could there ever be? • Experts “guess-ti-mate” • 500,000 on any given night • 1.5 million at some time during the course of the year • Causes • They are poor • Personal traits • One-third are substance abusers • One-fourth suffer from mental illnesses • One third are entire families due to structural changes in economy “new homeless”