Download

1 / 39
390 likes | 502 Views
An Analysis of Sampling Effects on Graph Structures Derived from Network Flow Data. Mark Meiss Advanced Network Management Laboratory Indiana University. Quick Overview. Why this study? Existing work focuses on the effects of sampling on individual flows or distributions of flows.

E N D
An Analysis of Sampling Effects on Graph Structures Derived from Network Flow Data Mark Meiss Advanced Network Management Laboratory Indiana University
Quick Overview • Why this study? • Existing work focuses on the effects of sampling on individual flows or distributions of flows. • Open question: How are graph structures built from flow data affected?
Quick Overview • Building graphs from flow data • Basic graph properties • Methodology • Experiments • Results • Take-home message: Aggregation matters and is not your enemy.
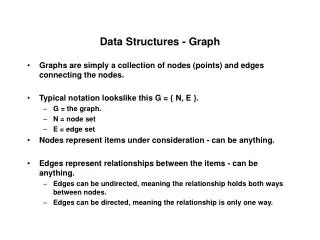
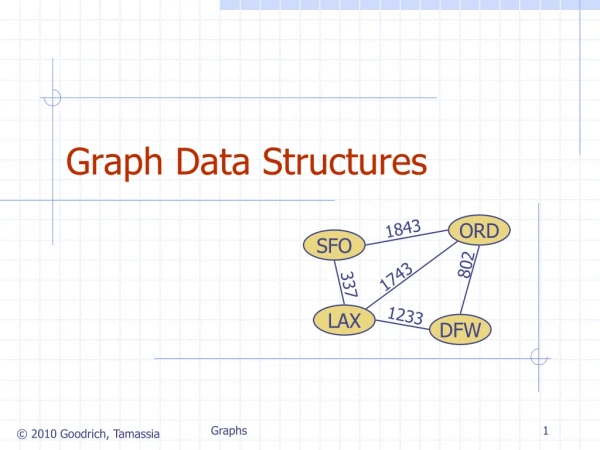
Background • “graph structures derived from network flow data”… ?
Applications • Modeling and prediction • Anomaly detection • Application classification • Capacity planning • Community identification • (etc.)
Motivation • So what does packet sampling have to do with this? • Isn’t knowing p(sample) = 0.01 good enough?
Motivation • The distributions of degree and strength for large-scale network data generally obey a power law:
Motivation • The exact value matters!
Methodology • Internet2 / Abilene used as testbed • Generate UDP traffic and analyze its traces in Abilene netflow-v5 data
Flow Generation Language (FGL) • FGL is a scripting language for quick and easy traffic generation: println("Bias study #4 (2008-12-10)"); println(); println("This FGL code will generate 100 128-byte packets to each UDP port"); println("in the range 10100-10199 on the hosts 64.57.17.200 - 64.57.17.209."); println(); x = proc(pkt) begin println("Emitting 100 of ", pkt); notate(pkt); emit(pkt, 100, 0.02); delay(0.10); end; port = range(10100, 10199); host = range(start:ip("64.57.17.200"), end:ip("64.57.17.209")); xip = [ ip_header(src:ip("156.56.103.1"), dst:@host) ]; xudp = [ udp_header(src_port:0, dst_port:@port) ]; xpacket = [ udp(@xip, @xudp, size:128, data:"This is a test.") ]; output("bias-study-4.event"); x(@xpacket);
Experiment #1 Note: p(sample) = 0.03. Generate flows of lengths between 1 and 200 packets; find chance of detection.
Experiment #2 Try to recover a power law, gamma = 2. Send to each of 10 hosts: • 256 10-packet flows • 128 20-packet flows • 64 40-packet flows • (etc.)
Experiment #3 Second attempt to recover gamma = 2: Send to each of 10 hosts: • 2048 10-packet flows • 1024 20-packet flows • 512 40-packet flows • (etc.)
Experiment #4 Third attempt to recover gamma = 2: Send to each of 10 hosts: • 1024 100-packet flows • 512 200-packet flows • 256 400-packet flows • (etc.)
Result • A preponderance of very small flows will lead to an overestimate of the exponent. • All flows smaller than a critical threshold are statistically indistinguishable.
Result • With sufficiently large flow size, a range of exponents can be recovered reliably.
Is this a problem? • What if we don’t have sufficiently large flow size?
Aggregation • Aggregation is necessary for accurate results! • Flows repeat themselves. • Coalescing flows with identical endpoints allows us to distinguish smaller flows.
Aggregation • Failure to aggregate on the experiments described causes an over-estimate of about 0.2. • This can make a large difference for modeling!
Conclusions • Given appropriate aggregation, packet sampling does not affect the large-scale properties of graphs derived from flow data. • The effectiveness of aggregation in mitigating small-flow effects depends on repeated activity.
Future Work Effects on other properties (clustering, centrality, spectral). Effects on network growth models (preferential attachment, etc.). Effects on traffic models (PageRank, other Markov models).
Thank you! Any questions or observations?