Download
1 / 2
20 likes | 153 Views
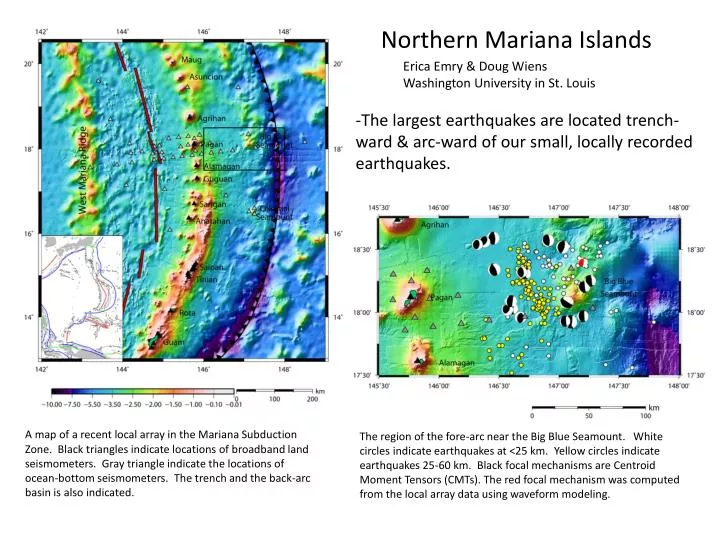
Northern Mariana Islands. Erica Emry & Doug Wiens Washington University in St. Louis. -The largest earthquakes are located trench-ward & arc-ward of our small, locally recorded earthquakes.

E N D
Northern Mariana Islands Erica Emry & Doug Wiens Washington University in St. Louis -The largest earthquakes are located trench-ward & arc-ward of our small, locally recorded earthquakes. A map of a recent local array in the Mariana Subduction Zone. Black triangles indicate locations of broadband land seismometers. Gray triangle indicate the locations of ocean-bottom seismometers. The trench and the back-arc basin is also indicated. The region of the fore-arc near the Big Blue Seamount. White circles indicate earthquakes at <25 km. Yellow circles indicate earthquakes 25-60 km. Black focal mechanisms are Centroid Moment Tensors (CMTs). The red focal mechanism was computed from the local array data using waveform modeling.
- Small locally-recorded earthquakes connect regions of CMT shallow thrust earthquakes. - Plate interface earthquakes occur deeper than the crust-mantle boundary. A cross-section of the study region oriented parallel with plate motion. Bathymetry and the location of the Big Blue Seamount (green triangle) & fore-arc ocean bottom seismometers (cyan squares) are shown. Red squares show the trace of the subducting slab as found by Oakley et al (2008) and black crosses show the location of the Moho as found by Takahashi et al (2007). Depth errors for most local earthquakes (yellow) are quite small (~1-2 km). Depth errors for relocated CMTs are shown with error bars. The local earthquakes show the continuance of plate interface earthquakes deeper than the intersection of the crust-mantle boundary. Keep in mind that the cross-section is oriented parallel with plate motion – so the patch of earthquakes all occurring at the same depth between the CMTs appear scattered with longitude.