Download
1 / 5
50 likes | 124 Views
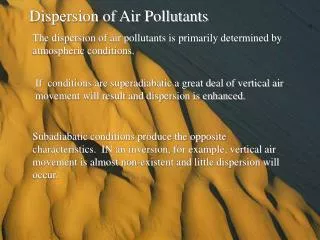
Focus Area 8: Environmental Health Progress toward Objective Targets. Moved away from target Moved toward target Met target. 8-1. Harmful air pollutants (1997, 2001)

E N D
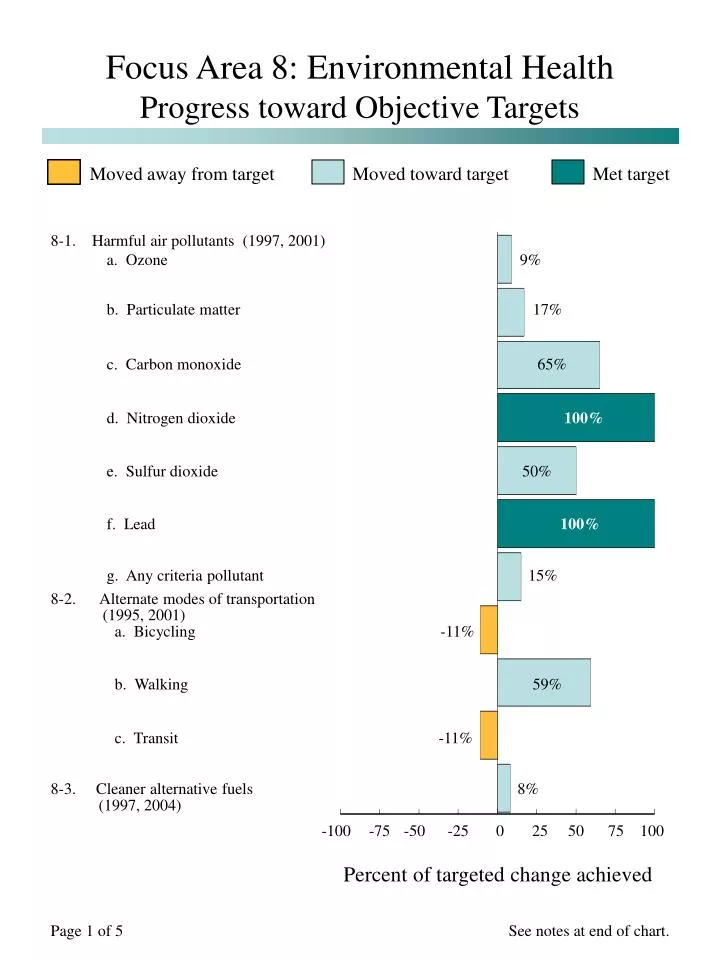
Focus Area 8: Environmental Health Progress toward Objective Targets Moved away from targetMoved toward target Met target 8-1. Harmful air pollutants (1997, 2001) a. Ozone 9% b. Particulate matter 17% c. Carbon monoxide 65% d. Nitrogen dioxide 100% e. Sulfur dioxide 50% f. Lead 100% g. Any criteria pollutant 15% 8-2. Alternate modes of transportation (1995, 2001) a. Bicycling -11% b. Walking 59% c. Transit -11% 8-3. Cleaner alternative fuels 8% (1997, 2004) -100-75-50-250 25 50 75 100 Percent of targeted change achieved Page 1 of 5 See notes at end of chart.
Focus Area 8: Environmental Health Progress toward Objective Targets (continued) Moved away from targetMoved toward target Met target 8-5. Safe drinking water: community 55% water systems (1995, 2004) 8-6. Waterborne disease outbreaks -25% (1987-96, 2002) 8-9 Beaches open and safe for swimming 50% (2002-2005) 8-10 Fish consumption advisories a. Rivers and streams -580% b. Lakes and reservoirs -64% 8-11. Elevated blood lead levels: 68% 1-5 years (1991-94, 1999-2002) 8-12 Risks posed by hazardous sites a. National Priority List 112% 8-13. Pesticide exposures causing 33% health care visit(s) (1997, 2004) 8-15 Recycled municipal waste 33% (1996-2003) 8-22. Pre-1950s homes tested for lead- 15% based paint (1998, 2002) 8-23. Substandard housing units 24% (1995, 2005)Target met at baseline -100-75-50-250 25 50 75 100 Percent of targeted change achieved Page 2 of 5 See notes at end of chart.
Focus Area 8: Environmental Health Progress toward Objective Targets(continued) Moved away from targetMoved toward target Met target 8-24. Exposure to pesticides (1988-94, 2002) a. Methyl parathion and parathions 82% b. Chlorpyrifos -36% c. Propoxur 100% 8-25. Exposure to pesticides, heavy metals, and selected environmental chemicals (1999-2000, 2001-2002) b. Cadmium 0% c. Lead 33% e. Mercury (children 1-5 years) 57% g. o-phenylphenol 128% m. Oxychlordane -36% o. DDT -102% p. Lindane 124% q. Mercury (females 16-49 years) 119% r. trans-Nonachlor 5% s. Heptachlor epoxide 32% -100-75-50-250 25 50 75 100 Percent of targeted change achieved Page 3 of 5 See notes at end of chart.
Focus Area 8: Environmental Health Progress toward Objective Targets(continued) Moved away from targetMoved toward target Met target 8-29. Global deaths from poor sanitation, 150% water, or hygiene (1990, 2000) 8-30. Wastewater service provided: US-Mexican Border (1997, 2002) a. Ciudad Acuna 360% b. Matamoros 0% e. Piedras Negras 200% f. Reynosa 180% 8-30. Wastewater receiving treatment: US-Mexican Border (1997, 2002) g. Ciudad Acuna 750% h. Matamoros 0% k. Piedras Negras 750% l. Reynosa Target met at baseline -100-75-50-250 25 50 75 100 Percent of targeted change achieved Page 4 of 4 See notes at end of chart.
NOTES: Tracking data for Objectives 8-2d, 8-4, 8-7, 8-8a, 8-8b, 8-12b through 8-12d, 8-14a, 8-14b, 8-17 through 8-21, 8-25a, 8-25d, 8-25f, 8-25h through 8-25l, 8-26, 8-27a through 8-27k, 8-27o, 8-30c, 8-30d, 8-30i and 8-30j are unavailable. Objectives 8-24a, 8-27l, 8-27m, 8-27n, and 8-28 were deleted at midcourse. Years in parentheses represent the baseline data year and the most recent data year used to compute the percent of the Healthy People 2010 target achieved. ( ) Most recent value – baseline value —————————————— Year 2010 target – baseline value Percent of targeted change achieved = X 100 Focus Area 8: Environmental Health Progress toward Objective Targets(continued) Page 5 of 5