Download
1 / 29
290 likes | 291 Views
ChipViewer is a Unix/Linux software that visualizes and analyzes tiling chip data for data normalization, data mining, gene detection, and expression analysis.

E N D
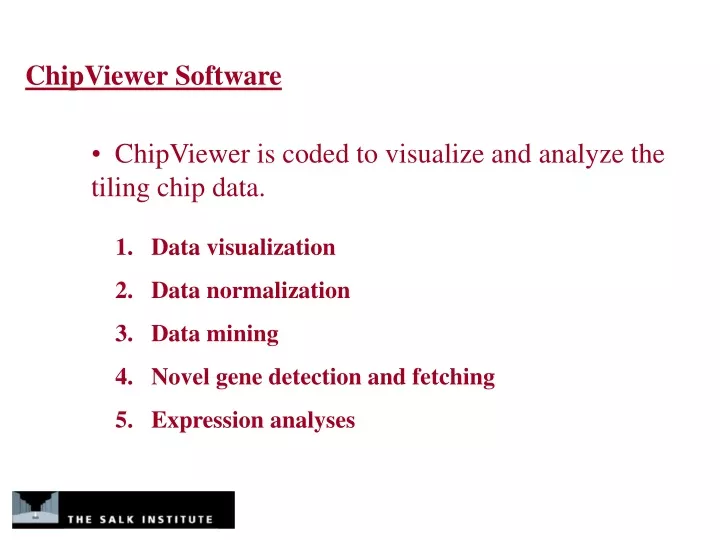
ChipViewer Software • ChipViewer is coded to visualize and analyze the tiling chip data. • Data visualization • Data normalization • Data mining • Novel gene detection and fetching • Expression analyses
ABSTRACT The SSP tiling chips, which cover the whole Arabidopsis thaliana genomic sequences, are customarily designed for multi-purposes: To map transcriptional units of the Arabidopsis ORFeome, to mine and identify novel transcripts and small RNA species, to do high-throughput polymorphism detection among Arabidopsis accessions and to identify evolutionarily conserved non-coding regions in Brassica. The ChipViewer, a Unix/Linux based application, is coded in-house in the Salk Institute Genomic Analysis Laboratory (SIGnAL) to qualitatively and quantitatively analyze the huge amount of data generated bye tiling chip experiments. Its X/Motif graphic user interface (GUI) allows uses to view chip expression profiles, de-convoluted chip expression profiles and histograms. An improved Match-only Integral Distribution algorithm (MOID) is introduced to call gene or genomic region absolute expression. In addition, a Relative Weight (RW), instead of normalization, is adopted to make it possible for universal comparison and analysis among different chip experiments. Furthermore, its comparative analysis tool allows for discovery of Single Feature Polymorphisms (SFPs) among Arabidopsis accessions, which will be useful markers for mapping QTLs using natural variations in the weed. A snapshot can be reached at http://signal.salk.edu/chipviewer/ 1. ChipViewer:
3. ChipViewer: De-Convolution of The Virtual Tiling Chip In the tiling chip, probes are randomly allocated. Raw De-convoluted
5. ChipViewer: Histograms of Hybridization Signals in Genomic Orders Find:to find an annotated gene Mining:to detect expressing regions Specially novel regions Fetch:to fetch a regional sequence
7. ChipViewer: Normalization – Linear regression normalization y = a x + b After normalization: a = 1 and b = 0 for two sets of chip data y = a x + b a b y – log (intensity of the chip to be normalized) x – log (intensity of the standard chip) a – slope b – intercept
8. ChipViewer: Normalization – Linear regression normalization 2 Two sets of data different to each other
9. ChipViewer: Normalization – Distribution normalization Use a standard distribution or other chip’s distribution model to normalize a set of data Normalization based on the distribution of the 2nd chip
10. ChipViewer: Normalization – Comparing the 2 models Linear regression model Distribution based model
11. ChipViewer: Statistic Methods and Algorithms Weight – Statistical analyses • Cramer von Mises test ( two tails) • Kolmogorov-Smirnov test ( two tails) • Weight(one tail) n Wt = Σ(SN(ƒ(i)) – F(ƒ(i))) d(ƒ(i)) Rw = Wt / Wo 1
12. ChipViewer: Weight – Statistical analyses 2 1 NULL distribution Chip distribution Di DKS Distribution ofSelected probes Wt 0 x
13. ChipViewer: Relative Weight – Statistical analyses 3 1 NULL distribution Chip distribution Di Dks (i) Wt Wo DKS (NULL) Distribution ofSelected probes Rw = Wt / Wo 0 x
14. ChipViewer: Weight – Statistical analyses 4 chip DKS Samples NULL distribution chip distribution v p(v)
15. ChipViewer: Weight – Statistical analyses 4-2 Samples chip NULL distribution chip distribution
16. ChipViewer: Detection of novel genes Use Mining button to detect the expression regions. This gene is now annotated asAt1g09645in the latest AGI genome. Use Mining button to detect the expression regions.
17. ChipViewer: Detection of novel genes 2 From the latest AGI genome to the future annotation ATG ATG TAA RAFL Nothing in the latest AGI genome, but a new gene At1g11765will be there in the future version.
18. ChipViewer: Mapping of transcriptional units of ORFeome From 2000v At1g09750 (MIPS) to the latest AGI At1g09750 2000 v Annotation (MIPS) The latest AGI Annotation
gDNA mRNA S (Salk) clones C (Chip) clones 20. ChipViewer: Mapping of transcriptional units of ORFeome Schematic of the Identification of New Genes
21. ChipViewer: Identification of sm RNAs 5’GACCCAATAAGCCGCTCCGATTGGA 3’ CCB5
Tiling Arrays Regions covered Total predicted ORFs ORFs w/o cDNAs or ESTs ORFs w/ evidence for expression Putative exons in intergenic regions chip 1a Chr. 1 1.8-3.0 Mb 320 110 72 2 chip 1b Chr. 1 3.0-4.2 Mb 300 104 79 6 chip 2c Chr. 2 17.0-18.2 Mb 328 117 96 1 chip 2d Chr. 2 18.2-19.5 Mb 321 100 83 3 1269 431 330 12 22. ChipViewer: Evidence for Genes with Expression
23. ChipViewer: Sense and anti-sense Discovery of Sense and anti-sense signals in Plasmodium and Arabidopsis. Sense Anti-Sense Signals of the gene PFC0110win Plasmodium.
24. ChipViewer: Data fetching Detect Fetch Six frames Sequence
25. ChipViewer: Comparing multiple sets of data There are 3 sets of the Plasmodium tiling chip data respectively in red, blue and green bars. ---- The Plasmodium tiling chip is a perfect match only chip
26. ChipViewer: Comparing multiple sets of data (cluster tracks) There are 9 sets of the chip data .
27. ChipViewer: Outputs • Output of de-convoluted data ( raw/normalized) • Output of expression proportion – output of the signal proportion of exon, intron and intragenic regions. • Output of expression data mining – output of the expressing regions and their weights. • Output of all or selected probe sets and genes’ expressing data (statistical weight).
Acknowlegements Thanks to Dr. Ecker, Dr. Lim and others at the Salk Institute Genomic Analysis Laboratory for their suggestions, comments and supports, as well as thanks to Dr. Winzeler and Dr. Grunenfielder from Scripps Institute. Huaming Chen