Download
1 / 46
460 likes | 593 Views
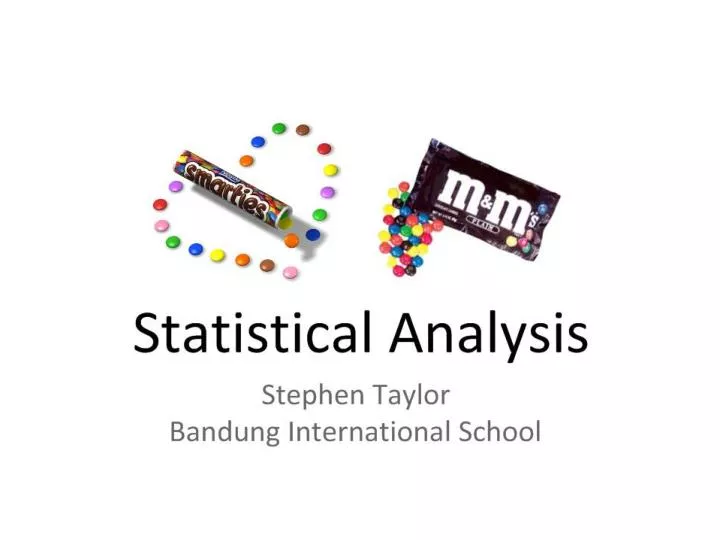
What is Data?. Information, in the form of facts or figures obtained from experiments or surveys, used as a basis for making calculations or drawing conclusions Encarta dictionary . Two Types of Data:. Qualitative Quantitative. Qualitative Data.

E N D
What is Data? Information, in the form of facts or figures obtained from experiments or surveys, used as a basis for making calculations or drawing conclusions Encarta dictionary
Two Types of Data: Qualitative Quantitative
Qualitative Data • Information that relates to characteristics ordescription (observable qualities) • Information is often grouped by descriptive category • Examples • Species of plant • Type of insect • Shades of color • Rank of flavor in taste testing Remember: qualitative data can be “scored” and evaluated numerically
Qualitative data, manipulated numerically • Survey results, teens and need for environmental action.
Quantitative Data • Quantitative – measured using a naturally occurring numerical scale • Examples • Chemical concentration • Temperature • Length • Weight…etc.
Quantitative Data • Measurements are often displayed graphically
Quantitation = Measurement • In data collection for Biology, data must be measured carefully, using laboratory equipment (ex. Timers, metersticks, pH meters, balances , pipettes, etc) • The limits of the equipment used add some uncertainty to the data collected. All equipment has a certain magnitude of uncertainty. For example, is a ruler that is mass-produced a good measure of 1 cm? 1mm? 0.1mm? • For quantitative testing, you must indicate the level of uncertainty of the tool that you are using for measurement!!
How to determine uncertainty? • Usually the instrument manufacturer will indicate this – read what is provided by the manufacturer. • Be sure that the number of significant digits in the data table/graph reflects the precision of the instrument used (for ex. If the manufacturer states that the accuracy of a balance is to 0.1g – and your average mass is 2.06g, be sure to round the average to 2.1g) Your data must be consistent with your measurement tool regarding significant figures.
Finding the limits • As a “rule-of-thumb”, if not specified, use +/- 1/2 of the smallest measurement unit (ex metric ruler is lined to 1mm,so the limit of uncertainty of the ruler is +/- 0.5 mm.) • If the room temperature is read as 25 degrees C, with a thermometer that is scored at 1 degree intervals – what is the range of possible temperatures for the room? • (ans.s +/- 0.5 degrees Celsius - if you read 15oC, it may in fact be 14.5 or 15.5 degrees)
Looking at data • How accurate is the data? (How close are the data to the “real” results?) This is also considered as BIAS • How precise is the data? (All test systems have some uncertainty, due to limits of measurement) Estimation of the limits of the experimental uncertainty is essential. • Let’s do a sample problem: