Download
1 / 38
390 likes | 519 Views
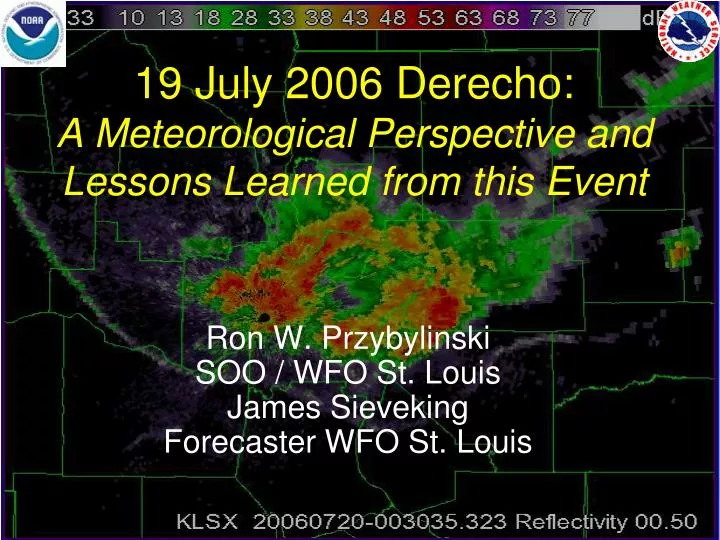
19 July 2006 Derecho : A Meteorological Perspective and Lessons Learned from this Event. Ron W. Przybylinski SOO / WFO St. Louis James Sieveking Forecaster WFO St. Louis . Outline of this Presentation:. Storm Prediction Center Perspective during the early part of the event.

E N D
19 July 2006 Derecho:A Meteorological Perspective and Lessons Learned from this Event Ron W. Przybylinski SOO / WFO St. LouisJames Sieveking Forecaster WFO St. Louis
Outline of this Presentation: • Storm Prediction Center Perspective during the early part of the event. • Meteorological Conditions during the afternoon of 19 July 2006 • WSR-88D Doppler radar analysis of the storm complex as it moved through the Bi-State region including the immediate St. Louis metro area. • Some final comments
Storm Prediction Center Perspectiveat 1:00 PM CDT(Moderate Risk of SVR) stretchedfrom southeast Minnesota throughfar northwest Illinois. A larger areaof Slight Risk covered much of Upper-Mississippi Valley region. Moasic radar imagery at 1:29 PM showing the thunderstorm complex entering northwest Illinois.
500 mb height and wind fields at 1:00 PM CDT. Upper-level Ridgeextended across the region through the central plains. RUC Skew-t at 1:00 PM CDTover Lincoln IL (ILX). SBCAPE 7116 J/Kg0 – 6 km Shear 14 m s-1Note the presence of very dry airaloft over central Illinois suggestingstrong downdraft potential.
SPC Meso Analysis for 1:00 PMStrength of the vertical wind shear(0 – 6 km deep layer). Strongest shear was confined to the Upper Mississippi Valley Region. ML CAPE for 1800 UTC. Axis ofgreatest instability extendedfrom southern Wisconsin through central Illinois and from southeastIowa through east-central Missouri
NAM 00HR Forecast (VT 1800 UTC 19 July 2006)Corfidi Vectors NAM 06 HR Forecast(VT 0000 UTC 20 July 2006)Corfidi Vectors
Storm Prediction Center Perspective for 3:00 PM CDT.Moderate Risk continued to stretched from northern Iowathrough Northern Illinois. SlightRisk surrounded the moderaterisk area. Mosaic radar imagery at 2:45 PM CDT showing the thunderstorm complex moving south-southeast.
IR Imagery taken at 3:02 PM CDT. Coldest cloud tops werelocated between Quad Cities and Peoria Illinois.
SPC Mesoscale analysis for3:00 PM CDT. ML CAPE / CIN. Axis of strongest Instabilityextended from central Iowa through eastern half of MissouriML CAPE values > 6000 J/kg. Light blue suggest stable region. Severe convective complex moving SSE along and east of the axis of highest instability.
Storm Prediction Center perspective for 5:00 PM CDT.A new severe thunderstorm watchwas issued for much of Central Illinois. WFO LSX Issued SVR TSTM Warnings for a few isolated stormsover central Missouri at this time. Mosaic radar imagery for 5:00 PM (right) continued to show the complex of thunderstorms movingnearly south at this time (Along and east of the axis of greatest instability).
IR Imagery for 5:02 PM CDT. Coldest cloud tops have movedtoward the leading edge of the convective system and further cooled.
SPC Mesoscale analysis for 5:00 PM CDT. Axis of highest instability (CAPE)continued to stretch from central Iowa through easternMissouri. The location of the instabilityaxis moved to the east over eastern Missouri. Note the blue area south-central Illinois suggesting some stability. Mosaic Radar Imagery for 5:00 PM CDT.
RUC model sounding for 2100 UTCat STL. Most Unstable ParcelCAPE 3733 J/Kg.CIN -19 J/kg;Bulk Shear for 0 – 3 km 10 m s-1,0 - 6 km14 m s-1.(Weak Shear category – unorganized convection) RUC model sounding for 2200 UTCat STL. Most Unstable Parcel CAPE 3629 J/Kg CIN -7 J/kg
Theta-e plots from RUC for STL and SLO at 2100 UTCSTL SFC – 700 mb (left) 38 K SLO SFC – 700 mb (below)33 K.
RUC Model sounding at 2100 UTCat Salem (SLO) Illinois. Most Unstable Parcel CAPE 2476 J/Kg CIN -51 J/kg;Bulk Shear 0 - 3 km 8 m s-1 0 – 6 km13 m s-1 (Weak Shear category) RUC Model sounding at 2200 UTCat Salem (SLO) Illinois CAPE 2560 J/kg CIN -22 J/kg
IR Imagery for 8:01 PM. Note how the coldest cloud tops have shifted to the leading edge of the convective complex.(Gurka 1979) documented the shifting of coldest cloud tops to the leading edge with intensifying convective complexes
Conceptual model of a multicell cluster storm complex.(NSSL)
4-Panel Reflectivity images from KLSX at 2303 UTC We are able to observe a mulitcellular cluster structure rather thana solid bowing segment. Why? The vertical wind shear within the0 – 3 km and 0 – 6 km layers fell into the weak shear category.
4 Panel storm-relative velocity images for 2303 UTC Where is the MARC velocity signature? After reviewing a number of MARCcases during the 1990s and early 2000s– the MARC signature was not observed in multicell cluster or near the southwest end of an asymmetric convective system.
6:32 PM CDT Reflectivity (left), Base-velocity Image (right). The strongest winds were detected along the leading edge and within the stronger thunderstorm cells. Several witnessesover southern Macoupin County experience hail up to nickel size with the stronger downbursts behind the leading gust front.
7:01 PM CDT Reflectivity (left), Base velocity (right). The strongest winds were detected with the higher reflectivity cores over northwest Madison County Illinois.
88 mph 6:35 PM Bunker Hill ASOS / AWOS Surface Observation sites around the GreaterSt. Louis metro area. Bunker Hill – unofficial site.
Now lets take a look how discrete severe cells embeddedwithin the cluster formed…mature and weakened with time. Within this sequence we are viewing the storm NE of KLSX 6:56 PM CDT / Cross-section of a developing cell northeast of KLSXusing NSSL’s Warning Decision Support System II
We are using NSSL’s Warning Decision Software System(WDSS-II). 7:01 PM CDT - Our Cell is intensifying and growing since 6:56 PM
7:06 PM CDT – a mature cell has formed at this time. Much of the high reflectivity is still aloft.
7:11 PM CDT: The high reflectivity core is descending – damaging windshail and rain reaches the surface just before this time.
7:16 PM CDT…our cell further collapses with the high reflectivity coredescending to the surface.
7:21 PM CDT…our original cell has weakened considerably. A very strongnew cell near the KLSX radar is descending at this time.
Loop of the evolution of a single severe cell within the storm complex.
Microburst and Severe Thunderstorm Project (MIST) – Huntsville AL (1986). Wakimoto (18th Conf. SLS) 1307 L 1311 L 1324 L Sequence of cloud photogrammetry and radar reflectivity data from NCAR CP-2 Doppler radar. Time sequence 1307 LST, 1311, and 1324 LST. 1307 L– distinct growing tower with 60 dBZ (8 km) (Differential reflectivities (ZDR)values are low (3 – 5 db) suggesting the presence of ice with the 60dBZ core.1311 L: 60 dBZ core is mostly ice (ZDR values remain low (3 – 4 db). 1324L:60 dBZ core has descended – microburst occurs with small hail. ZDR hole waspresent. (Evaporation of pcpn and melting of ice drives intense downdrafts).
8:29 PM CDT Reflectivity (Left); Base velocity (right)Some of the strongest velocities observed at this time were located in southern Jefferson county MO (75 – 85 kts). Also note the divergentvelocity signature over Monroe county Illinois suggesting damaging wind area.
When was the last time we documented as case similarto the July 19, 2006 Derecho? Aug 10, 1992. The convective complex formed just southwest of KLSXand moved south-southward through west-central Arkansas. Widespread wind damage occurred across parts of southern Franklin,Crawford, western Iron and points to the south-southwest. (www.crh.noaa.gov/lsx/?n=damagingwnd)
The July 19 2006 damage map reveals that much of the downbursts was oriented from north-northeast to south-southwest – an unusual direction.This direction of damaging winds future intensified the degree of damage over the greater St. Louis metro area.
Summary • A convective complex of severe storms caused severe wind damage and destruction over much of the greater St. Louis metro area and surrounding counties duringthe late afternoon and evening of 19 July 2006 • Over 500,000 people were without power for several days and suffering from the heat and humidity after the event. - The atmosphere over the Mid-Mississippi Valley regionwas characterized and extremely unstable with ML CAPE values reaching 6000 J/Kg while a deep dry layerof air was present aloft over the region.
NAM forecast of Corfidi vectors for 1800 UTC (00 HR)and 0000 UTC (06 HR) suggested that if the convectivecomplex survived through the early evening hours the system would travel south across central Illinois then south-southwest into parts of extreme east-central through southeast Missouri.- RUC soundings at 2100 and 2200 UTC over STLshowed a very weak cap at this time. -
Surface winds along the leading edge of the gustfront varied between 20 to 25 m s-1. - The stronger surface winds were associated with the isolated convective towers and smaller convective • clusters trailing the gust front. Wind speeds were estimated as high as 40 m s-1.- This event was one of the more challenging cases, from both a national and local WFO perspective.