Download
1 / 9
210 likes | 952 Views
History. What Factors Affect Population?. Environment. Migration. Technology. Policy. Predicting Population Change. Why do you think that there is a projected decrease In the world population growth?. Do you think that the decrease is consistent throughout the world?. People realized….

E N D
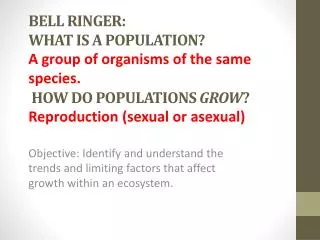
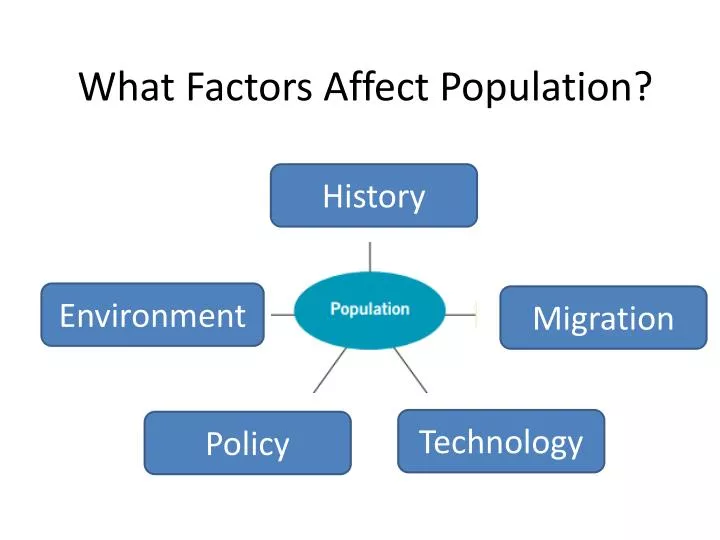
History What Factors Affect Population? Environment Migration Technology Policy
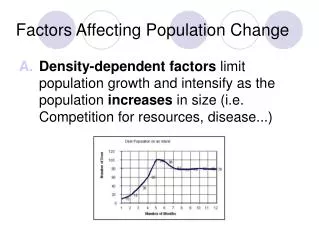
Predicting Population Change Why do you think that there is a projected decrease In the world population growth? Do you think that the decrease is consistent throughout the world? • People realized…. • That as the infant mortality rate dropped, due to advance in medicine, it was more likely that their children would live to adulthood in developed countries • Fighting diseases and lowering infant mortality rate in developing countries was key but families continued to be large • Health care systems can not support a large population growth i.e. baby boomers • Natural land areas such as the rain forest can not be saved if the land is needed for people • In developing countries (i.e. Northern Africa) the ability for the land to feed people, as a result of natural disasters, war and climate change, • has been exceeded.
Environment The environment may shape human choices but it doesn’t rule them. Although we can adapt, especially with our technological knowledge, people tend to be attracted to locations with the most favourable environments. History Historically, populations expanded where agricultural civilizations prospered such as China, Middle East and India. Other regions relied on hunting and gathering. How do you think population is affected by the agricultural industry today?
Migration Throughout history people have moved in search of a better life. Much of Canada’s European population came here from France and Britain. immigration emigration A positive net migration means more people move into the country than the number who left in the same year. How might migration effect the population already present in the destination country?
Technology Technology can affect population by allowing people to make environments more livable. Technologies also influence human life and death, directly affecting population. Fertile soil
Policies Government policies can also affect population. In 1979 China created the “One Child Policy to limit the pressure of the population increases on society. Couples are permitted to have only one child. A second child will result in heavy fines. What could be the long term effects of this policy – both negative and positive? What are the pressures? Geo Skill: Drawing and Interpreting Population Pyramids A population pyramid is a graph that provides a snapshot of a countries population at one point in time. It can be used to find patterns by comparing two countries or two time periods. Most importantly – it can be used to predict future changes in a society.
World Population Pyramids high population density moderate population density low population density What do you notice?
Canada’s Population Pyramid Check out Canada’s changing population trends from 1921-2011. http://www12.statcan.gc.ca/census-recensement/2011/dp-pd/pyramid-pyramide/his/index-eng.cfm • Two horizontal bar graphs in one • Vertical scale shows age groups in the population • Horizontal scale shows the percentage of the population in each age group • The percentages increase in each direction from the centre point • Left side shows males • Right side shows females Using the information on page 41, create your own population pyramid for Canada, 2006. Compare the population pyramids form 1991 and 2006. What changes do you see? Predict what a pyramid for 2023 would look like?