1 / 1

Figure 4.6a. Acute hepatitis C reports*, by risk exposure † — United States, 2009

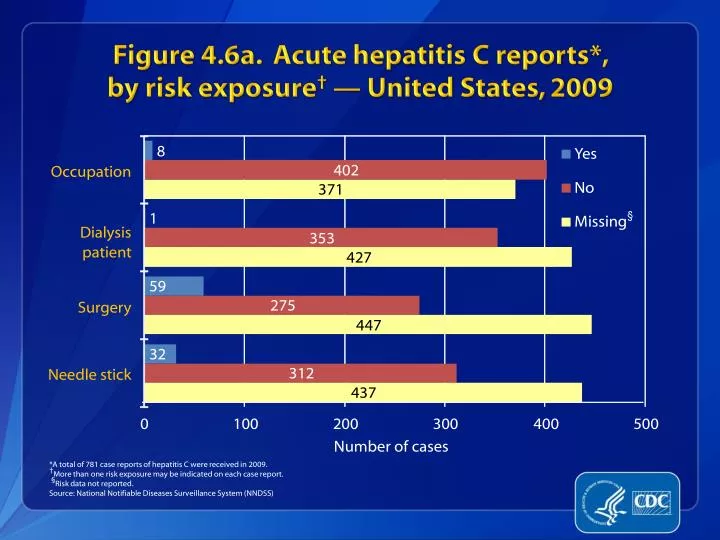
8. Yes. 402. Occupation. No. 371. 1. Missing. §. Dialysis. 353. patient. 427. 59. 275. Surgery. 447. 32. 312. Needle stick. 437. 0. 100. 200. 300. 400. 500. Figure 4.6a. Acute hepatitis C reports*, by risk exposure † — United States, 2009. Number of cases.

yvon
Download Presentation

Figure 4.6a. Acute hepatitis C reports*, by risk exposure † — United States, 2009

An Image/Link below is provided (as is) to download presentation Download Policy: Content on the Website is provided to you AS IS for your information and personal use and may not be sold / licensed / shared on other websites without getting consent from its author. Content is provided to you AS IS for your information and personal use only. Download presentation by click this link. While downloading, if for some reason you are not able to download a presentation, the publisher may have deleted the file from their server. During download, if you can't get a presentation, the file might be deleted by the publisher.

E N D

Presentation Transcript


  1. 8 Yes 402 Occupation No 371 1 Missing § Dialysis 353 patient 427 59 275 Surgery 447 32 312 Needle stick 437 0 100 200 300 400 500 Figure 4.6a. Acute hepatitis C reports*, by risk exposure† — United States, 2009 Number of cases *A total of 781 case reports of hepatitis C were received in 2009. †More than one risk exposure may be indicated on each case report. §Risk data not reported. Source: National Notifiable Diseases Surveillance System (NNDSS)

More Related