Download
1 / 30
300 likes | 479 Views
Science of the Aqua Mission Claire L. Parkinson Aqua Project Scientist NASA Goddard Space Flight Center Presentation at TRW Redondo Beach, California December 18, 2001. Basics.

E N D
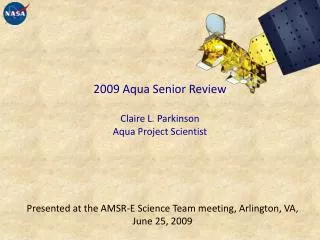
Science of the Aqua Mission Claire L. Parkinson Aqua Project Scientist NASA Goddard Space Flight Center Presentation at TRW Redondo Beach, California December 18, 2001
Basics • The Aqua spacecraft will carry six distinct instruments to measure numerous aspects of the Earth’s atmosphere, oceans, ice, land, and biosphere. • Atmospheric Infrared Sounder (AIRS) • Advanced Microwave Sounding Unit (AMSU) • Humidity Sounder for Brazil (HSB) • Advanced Microwave Scanning Radiometer for EOS (AMSR-E) • Clouds and the Earth’s Radiant Energy System (CERES; two) • Moderate-Resolution Imaging Spectroradiometer (MODIS) • Aqua is part of the international Earth Observing System (EOS) program, centered at NASA. • Terra, the first EOS spacecraft, was launched in December 1999.
The Aqua Science Instrumentsp.1, the Sounding Suite AIRS HSB ASMU / \ A1 A2 (Photos taken at TRW by D. Stroud)
The Aqua Science Instrumentsp.2, the Non-sounders AMSR-E MODIS (Photos taken at TRW by D. Stroud) Two CERES
Instrument Background CERES • The first CERES was launched on the Tropical Rainfall Measuring Mission (TRMM) in November 1997. The second and third CERES are on Terra. The next two are on Aqua. • The first MODIS is on Terra; the second is on Aqua. The Aqua MODIS incorporates several improvements. • The first AIRS is on Aqua. Its companion instruments, the AMSU and HSB, are similar to instruments on NOAA satellites. • The first AMSR-E is on Aqua. It follows on the heritage of earlier passive-microwave instruments. MODIS AIRS AMSR-E
The Aqua Science Teams • AIRS/AMSU/HSB Science Team, led by Moustafa Chahine, NASA Jet Propulsion Laboratory • AMSR-E U.S. Science Team, led by Roy Spencer, University of Alabama at Huntsville • AMSR-E Japanese Science Team, led by Akira Shibata, Japanese Meteorological Agency • CERES Science Team, led by Bruce Wielicki, NASA Langley Research Center • MODIS Science Team, led by Vincent Salomonson, NASA Goddard Space Flight Center
Major Objectives • Enhanced understanding of the global water cycle. • Enhanced weather forecasting. • Enhanced understanding of many components of the Earth’s climate system and their interactions. • Lengthening of the satellite-based record of many climate variables. • Enhanced understanding of the diurnal cycle of variables measured by CERES and MODIS.
Measurement Ranges ______________________________________ visible | infrared | microwave _______|____________|_________________ | -- MODIS -- | | ---- AIRS ---- | | ---------- CERES ------ | |-| HSB | --- AMSR-E --- | |----| |---| AMSU A1 A2
Key MODIS Data Products • Oceans • Primary productivity, photosynthetically active radiation, coccolith concentration, chlorophyll fluorescence, pigment concentration, phycoerythrin concentration, suspended solids and organic matter concentrations, attenuation coefficient, sea surface temperature, sea ice cover, sea ice albedo • Atmosphere • Cloud microphysical properties, cloud top properties, cloud mask, aerosol optical depth, aerosol size distribution, total ozone, total precipitable water, temperature and water vapor profiles • Land • Net primary productivity, land cover type and change, leaf area index, fraction of photosynthetically active radiation, gridded vegetation indices, fires, burn scars, land surface temperature and emissivity, snow cover, snow albedo, atmospherically corrected surface reflectance
Sample Images from the Terra MODIS, p.1 Dust over northwest Africa and vicinity, February 29, 2000 The Nile River and surroundings, February 28, 2000 Western hemisphere MODIS mosaic Sea ice at the North Pole and vicinity
Sample Images from the Terra MODIS, p.2 Enhanced Vegetation Index, September 30 – October 15, 2000 Sea Surface Temperature, May 2001 Daytime Average
Plans for the Aqua MODIS Data • Generate and analyze most of the same products as for the Terra MODIS. • Add a new Surface Evaporation Index. • Generate improved SSTs, benefiting from a change made to the Aqua MODIS in October 2000, reducing the saturation temperature for two of the data bands from about 400 K to about 340 K. • Examine the diurnal cycle from the combined Terra and Aqua data.
Key CERES Data Products • Fluxes of outgoing radiation at the top of the atmosphere • Shortwave radiation (solar radiation reflected from the Earth/atmosphere system) • Total radiation (reflected and emitted) • Longwave radiation (emitted from the Earth/atmosphere system) • Radiation in the 8-12 µm atmospheric window • Fluxes of shortwave and longwave radiation at the Earth’s surface • Fluxes of shortwave and longwave radiation at multiple levels in the atmosphere • Cloud temperature, cloud height, cloud pressure, and cloud optical depth
Sample Images from the Terra CERES, p.1 Night-time emitted thermal flux, March 3, 2000 Monthly average longwave flux, July 2000
Sample Images from the Terra CERES, p.2 Net cloud radiative forcing for July 2000
New Science Results from the TRMM and Terra CERES • The tropical radiative energy budget is much more dynamic and variable than previously thought. • Changes in the longwave and shortwave fluxes in the 1990s, versus earlier, are consistent with decreasing cloudiness. • The radiation variations are consistent with a strengthening of the Hadley and Walker atmospheric circulation patterns in the 1990s. • Evidence has been found counter to the Iris hypothesis that thin cirrus clouds in the tropics exert a large negative feedback in the climate system.
Major CERES Validation Efforts • The Chesapeake Lighthouse and Aircraft Measurements for Satellites (CLAMS) field experiment ran from July 10 to August 2, 2001. • The long-term CERES Ocean Validation Experiment (COVE) is on-going at the Chesapeake lighthouse. • Surface-based, aircraft, and balloon data from long-term validation sites in the Atmospheric Radiation Measure-ment (ARM) Baseline Surface Radiation Network are being used in the CERES ARM Validation Experiment (CAVE). • COVE and CAVE are both expected to continue during Aqua.
Key AIRS/AMSU/HSB Data Products • Temperature profiles through the atmosphere • Water vapor profiles through the atmosphere • Total precipitable water, cloud liquid-water content, precipitation indication, cloud-ice indication • Heights of the tropopause and stratopause • Cloud-top pressure and temperature, fractional cloud cover, cloud spectral properties, and cloud type • Ozone profile through the atmosphere • Total column atmospheric ozone, methane, carbon monoxide, and carbon dioxide • Sea and land surface skin temperature • Infrared and microwave surface emissivity • Longwave and shortwave radiative fluxes at the top of the atmosphere and at the surface
AIRS/AMSU/HSB Science Preparations • The final pre-launch Product Generation Software package has been delivered to the data center doing the data processing, archival, and distribution. • AIRS/AMSU/HSB data flow, display, retrieval, and analysis are being tested using a “golden day” concept with December 15, 2000 simulated data. • Validation support teams selected in 2001 in response to the Aqua Validation NASA Research Announcement (NRA) are being integrated into the validation plan. • The AIRS Team is working with weather prediction agencies in the U.S., Canada, and Europe to facilitate the incorporation of AIRS/AMSU/HSB data into weather forecasts.
Key AMSR-E Data Products • Rainfall • Water vapor (total atmospheric column) • Cloud water (total atmospheric column) • Sea surface temperature • Sea surface wind speed • Sea ice concentration • Sea ice temperature • Snow depth on sea ice • Snow-water equivalent on land • Surface soil moisture
AMSR-E Science March 1998 sea ice concentrations Nov. 1978 – Dec. 1999 sea ice extent deviations • The AMSR-E team will extend the data records from previous passive-microwave instruments. • Passive-microwave data have the advantage, for surface observations, of being obtainable under all lighting conditions and most weather conditions. • The AMSR-E will have improved spatial resolution over previous passive-microwave imagers (although still coarse resolution compared to visible sensors).
AMSR-E Validation Plans • A variety of validation efforts is planned, involving aircraft, ships, data buoys, radiosondes, field campaigns, and intercomparisons with other satellite data. • Validation support teams selected in 2001 in response to the Aqua Validation NRA are being integrated into the AMSR-E team and program. • An AMSR-E simulator, the Airborne Earth Science Microwave Imaging Radiometer (AESMIR), is under development. Navy P-3 used in Meltpond2000, a pre-launch validation exercise over sea ice in the Canadian Arctic The AESMIR
Recent Aqua Outreach Products, p.1 AIRS/AMSU/HSB brochure AMSR-E brochure
Recent Aqua Outreach Products, p.2 Aqua lithograph
In-Progress Aqua Outreach, Written Products to be Ready by Launch • An Aqua brochure • An Aqua Science Writers’ Guide • A Weather Forecasting Fact Sheet • A set of seven Aqua trading cards CERES is one of six Earth-observing instruments to be flown on board NASA’s Aqua satellite … Purpose:…. Size: ... Data channels: … Spatial resolution of the data: … Primary data products: … Provider: … Website: …
Other In-Progress Aqua Outreach • An Aqua science website, on-line at http://aqua.nasa.gov • Animations of the Aqua launch and deployment sequence (Reto Stockli) • Animations of the Aqua orbit and instrument sensing (Jesse Allen) • Science visualizations related to anticipated Aqua data sets (GSFC Scientific Visualization Studio) • Videotaping of Aqua scientists for the aqua.nasa.gov website and a CD-ROM (GSFC Special Project Initiatives Office) • A series of Aqua web casts, beginning on December 19, 2001, at TRW (GSFC Special Project Initiatives Office)
Aqua’s Delta II Rocket, Ready for Launch Rendering by Reto Stockli
The Delta Rocket and its Aqua Payload Rendering by Reto Stockli
The EOS Afternoon Satellite Constellation Rendering by Jesse Allen