Download
1 / 16
160 likes | 239 Views
Summary of examples of correlation between lithology and seimicity. Jessica Hawthorne Ge277 February 26, 2014. Outline. Mostly aseismic with small earthquakes Costa Rica Nankai SAF Zuccale. More clay: M ore velocity-strengthening at low slip speeds Lower absolute strength

E N D
Summary of examples of correlation between lithology and seimicity Jessica Hawthorne Ge277 February 26, 2014
Outline • Mostly aseismic with small earthquakes • Costa Rica • Nankai • SAF • Zuccale
More clay: • More velocity-strengthening at low slip speeds • Lower absolute strength Ikari et. al., 2011
Ikari et. al., 2013 • Northwest: • Cold • Few seamounts • Larger earthquakes • Southeast: • Hot • Seamounts • More small earthquakes Wang and Bilek, 2011
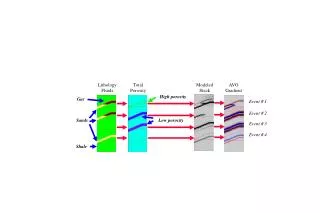
A recipe for small earthquakes? Hemipelagic ooze: Weak, mostly velocity-strengthening Nanofossil chalk on seamounts: Strong, velocity-weakening
Zuccale FaultNiemeijer and Collettini, 2013 • Low-angle normal fault in northenAppenines • Nearby faults have shallow microseismicity • Misorientation suggests low effective friction
Pink and orange: -Less talc, more quartz -More unstable
Less stable deeper • Small earthquakes on velocity-weakening patches
Nankaiaccretionary prism Ikari and Saffer, 2011 • Evidence that splay fault ruptured to the trench • Low frequency earthquakes along splay faults
Ikari and Saffer, 2011 • Mostly velocity-strengthening • Increase in a-b with slip rate mostly results from decrease in b • Suggests it’s hard to rupture seismically
Ujiie and Tsutsumi, 2010 • Strong velocity weakening at higher slip rates • From thermal pressurization
Tsutsumi et. al., 2011 • Some samples are v-w even at low slip rates • Would allow for small earthquakes
San Andreas FaultIrwin and Barnes, 1975 Locations from Waldhauser and Schaff, 2008 Creep and microseismicity coincident with serpentinite at the base of the Great Valley sequence?
So can lithology explain the observed distribution of earthquakes? • Maybe • 4 locations that are consistent, but not compelling • Clays generally stable at low slip speeds • Can be unstable at high slip speeds • Most instability added with more quartz or calcite