Download
1 / 1
10 likes | 22 Views
Site 1. Site 1. Site 2. Site 2. Site 3. Site 3. Site 4. Site 4. Urban Residential. Golf course. Forested Park. 3. 2. 4. 1. 1. 3. 2. 4. Seasonal Dynamics of Inorganic Nutrients in the Plum Creek Tributary of the Black River in NE Ohio as a Function of Land Use Practices.

E N D
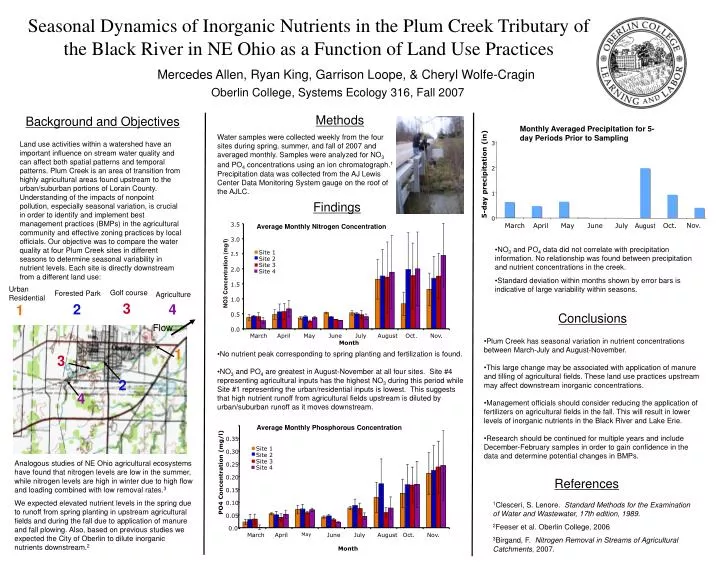
Site 1 Site 1 Site 2 Site 2 Site 3 Site 3 Site 4 Site 4 Urban Residential Golf course Forested Park 3 2 4 1 1 3 2 4 Seasonal Dynamics of Inorganic Nutrients in the Plum Creek Tributary of the Black River in NE Ohio as a Function of Land Use Practices Mercedes Allen, Ryan King, Garrison Loope, & Cheryl Wolfe-Cragin Oberlin College, Systems Ecology 316, Fall 2007 Methods Background and Objectives Monthly Averaged Precipitation for 5-day Periods Prior to Sampling Water samples were collected weekly from the four sites during spring, summer, and fall of 2007 and averaged monthly. Samples were analyzed for NO3 and PO4 concentrations using an ion chromatograph.1Precipitation data was collected from the AJ Lewis Center Data Monitoring System gauge on the roof of the AJLC. Land use activities within a watershed have an important influence on stream water quality and can affect both spatial patterns and temporal patterns. Plum Creek is an area of transition from highly agricultural areas found upstream to the urban/suburban portions of Lorain County. Understanding of the impacts of nonpoint pollution, especially seasonal variation, is crucial in order to identify and implement best management practices (BMPs) in the agricultural community and effective zoning practices by local officials. Our objective was to compare the water quality at four Plum Creek sites in different seasons to determine seasonal variability in nutrient levels.Each site is directly downstream from a different land use: 3 2 5-day precipitation (in) 1 Findings 0 3.5 Nov. March April May June July Oct. August Average Monthly Nitrogen Concentration 3.0 • NO3 and PO4 data did not correlate with precipitation information. No relationship was found between precipitation and nutrient concentrations in the creek. • Standard deviation within months shown by error bars is indicative of large variability within seasons. 2.5 NO3 Concentration (mg/l) 2.0 1.5 Agriculture 1.0 Conclusions 0.5 Flow 0.0 March April May June July August Oct. Nov. • Plum Creek has seasonal variation in nutrient concentrations between March-July and August-November. • This large change may be associated with application of manure and tilling of agricultural fields. These land use practices upstream may affect downstream inorganic concentrations. • Management officials should consider reducing the application of fertilizers on agricultural fields in the fall. This will result in lower levels of inorganic nutrients in the Black River and Lake Erie. • Research should be continued for multiple years and include December-February samples in order to gain confidence in the data and determine potential changes in BMPs. • No nutrient peak corresponding to spring planting and fertilization is found. • NO3 and PO4 are greatest in August-November at all four sites. Site #4 representing agricultural inputs has the highest NO3 during this period while Site #1 representing the urban/residential inputs is lowest. This suggests that high nutrient runoff from agricultural fields upstream is diluted by urban/suburban runoff as it moves downstream. Month Average Monthly Phosphorous Concentration 0.35 0.30 Analogous studies of NE Ohio agricultural ecosystems have found that nitrogen levels are low in the summer, while nitrogen levels are high in winter due to high flow and loading combined with low removal rates.3 We expected elevated nutrient levels in the spring due to runoff from spring planting in upstream agricultural fields and during the fall due to application of manure and fall plowing. Also, based on previous studies we expected the City of Oberlin to dilute inorganic nutrients downstream.2 0.25 PO4 Concentration (mg/l) References 0.20 0.15 1Clesceri, S. Lenore. Standard Methods for the Examination of Water and Wastewater, 17th edition, 1989. 2Feeser et al. Oberlin College, 2006 3Birgand, F. Nitrogen Removal in Streams of Agricultural Catchments, 2007. 0.10 0.05 0.0 March April May June July August Oct. Nov. Month