Download
1 / 43
430 likes | 583 Views
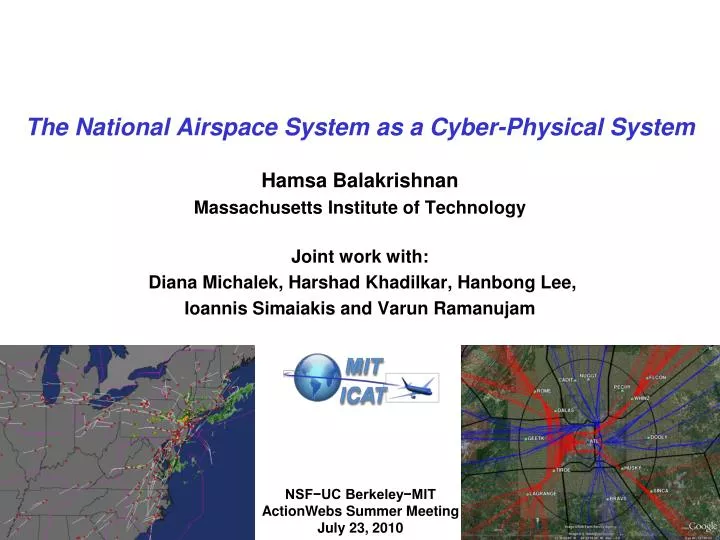
The National Airspace System as a Cyber-Physical System. Hamsa Balakrishnan Massachusetts Institute of Technology Joint work with: Diana Michalek , Harshad Khadilkar , Hanbong Lee, Ioannis Simaiakis and Varun Ramanujam. NSF−UC Berkeley−MIT ActionWebs Summer Meeting

E N D
The National Airspace System as a Cyber-Physical System Hamsa Balakrishnan Massachusetts Institute of Technology Joint work with: Diana Michalek, HarshadKhadilkar, HanbongLee, IoannisSimaiakis and VarunRamanujam NSF−UC Berkeley−MIT ActionWebs Summer Meeting July 23, 2010
Research objectives • Increase efficiency of operations • Multi-objective control techniques for balancing tradeoffs • Decrease fuel burn and environmental impact • Increase operational robustness in the presence of weather • More flexible and dynamic trajectories • More decentralized decision-making The use of onboard sensing in ActionWebs, combined with the development of hybrid systems models of aircraft trajectories can help us achieve these objectives
Motivation • In 2007, domestic air traffic delays [JEC, US Senate] • Had a $41 billion impact on the US economy • Cost airlines an additional $1.6 billion in fuel costs • Consumed an additional 740 million gallons of jet fuel • Released an additional 7.1 million tons of CO2 into the atmosphere • In 2007, aircraft in the U.S. spent over 63 million minutes taxiing in to their gates, and over 150 million minutes taxiing out for departure [FAA] • Taxiing aircraft burn fuel, and contribute to surface emissions of CO2, hydrocarbons, NOx, SOx and particulate matter • An estimated 6 million tons of CO2, 45,000 tons of CO, 8,000 tons of NOx and 4,000 tons of hydrocarbons are emitted annually by aircraft taxiing out • In Europe, aircraft are estimated to spend 10-30% of their time taxiing • A short/medium range A320 expends as much as 5-10% of its fuel on the ground [Airbus]
H S H S 196 s 60 s 196 s 452 s S H H S 60 s 60 s 96 s 216 s Efficient and equitable arrival/departure runway scheduling • Given a set of flights with estimated arrival times at the airport, the aircraft need to be sequenced into the landing (takeoff) order, and the landing (takeoff) times need to be determined • Minimum separation between operations for wake avoidance (wt. class dependent) (Safety) • Currently FCFS; resequencing could increase throughput (Efficiency) FCFS… 6 7 8 9 10 … … k = 2 … Trailing a/c Leading a/c Separation in seconds • Fairness: Constrained Position Shifting* *[Dear 1976, Psaraftis 1980, Garcia 1990, Volckers 1990, Neuman and Erzberger 1991, Venkatakrishnan, Barnett and Odoni 1993, Trivizas 1998, Beasley 2000, Anagnostakis 2001, Carr 2004]
Runway scheduling under Constrained Position Shifting (CPS) • Well-studied problem, using various (mostly heuristic) approaches • Challenge: Scheduling under CPS has been conjectured to have exponential computational complexity in the number of aircraft [Carr 2004] • Various interesting extensions can be solved in (pseudo-)polynomial time as shortest-path problems on variations of this network • Multiple objectives: Average delay, max. delay, sum of delay costs, fuel costs, operating costs, robustness to uncertainties, etc. • Evaluation of tradeoffs between multiple objectives • Key result: We have proved that this is not true • Basic idea: We propose a way to represent solution space as a network whose size is linear in the number of aircraft [Balakrishnan and Chandran AIAA GNC 2006; Operations Research (2010, to appear)] [USA/Europe ATM R&D Seminar 2007; Amer. Control Conf. 2007, Amer. Control Conf. 2008, Proceedings of the IEEE (2008)]
Stage 1 Stage 2 Stage 3 Stage 4 Stage 5 Stage 6 1-2-3 2-3-4 1-2-4 2-3-5 1-2-5 2-3-6 1-2-3 3-4-5 1-3-4 2-4-5 1-2-4 # of arcs 3-4-6 1-2 1-3-5 2-4-6 1-3-2 4-6-5 1 1-3 s 1-4-3 2-5-4 1-3-4 t 4-5-6 2 2-1 1-4-5 2-5-6 2-1-3 5-4-6 2-3 2-3-4 3-4-5 2-1-4 3-5-6 2-3-5 3-4-6 2-3-4 3-6-5 3-5-4 2-4-3 3-5-6 2-4-5 4-3-5 3-2-4 3-2-5 4-3-6 3-4-5 4-5-6 CPS network • Size of network is linear in the number of aircraft and exponential in k(≤3) • Easy to incorporate arrival time windows and precedence constraints • Precedence constraints make problem easier to solve Length = min(Stage#,2k+1) Length = (2k+1) n = 6, k = 1 [Balakrishnan and Chandran, AIAA GNC 2006; Operations Research (2010, to appear)]
Tradeoffs between throughput and delay costs Randomly generated sequence, 40% Heavy, 40% Large, 20% Small Delay costs of Heavy and Large are 9x (Delay cost of Small aircraft) This gain in throughput comes at a very high cost increase in cost throughput gain [Lee and Balakrishnan, Proceedings of the IEEE, 2008]
Is speeding up necessarily a good idea? • Accelerating from the nominal speed requires more fuel • However, speeding up the first aircraft in a sequence may decrease the delay incurred by subsequent aircraft • Concept of Time advance [Neuman and Erzberger 1991, Lee and Balakrishnan ACC 2008]
Evaluating the benefits of Time Advance • Total estimated fuel cost vs. allowable time advance [Lee and Balakrishnan, Proceedings of the IEEE, 2008]
Queuing network model of the taxi-out process • Model inputs (ASPM database) • Pushback schedules • Gate assignments • Runway configurations • Weather conditions • Desired outputs • Taxi-out time for each flight • Level of congestion on airport surface • Loading on departure queues
Estimating taxi-out time • Taxi-out time expressed as t = tunimpeded + ttaxiway + tdep.queue • Unimpeded taxi-out time (tunimpeded) dominates when the number of aircraft on the surface is low • Departure queue wait time (tdep.queue) dominates when the number of departures on the surface is high • Taxiway congestion term (ttaxiway) is important under medium traffic conditions • Parameter estimation: • Unimpeded taxi-out time • Departure throughput saturation • Runway service process [Simaiakisand Balakrishnan, AIAA GNC, 2009]
Improvement through including taxiway congestion term • Assume ttaxiway= aR(t) • R(t) is the number of aircraft on ramps and taxiways • Choose a for best parameter fit [BOS; 4L,4R|4L,4R,9; VMC] With taxiway congestion term Without taxiway congestion term [Simaiakisand Balakrishnan, AIAA GNC, 2009]
Model validation: departure throughput • Model validated on 2008 data [BOS; 4L,4R|4L,4R,9; VMC] With taxiway congestion term Without taxiway congestion term [Simaiakisand Balakrishnan, AIAA GNC, 2009]
Taxi times as a function of congestion Low (N ≤ 8) Medium (9 ≤N ≤16) High (N ≥ 17) [Simaiakisand Balakrishnan, AIAA GNC, 2009]
Prediction of taxi-out times min min [Simaiakisand Balakrishnan, AIAA GNC, 2009]
Model can be used to evaluate surface traffic management strategies • One potential strategy: “N-Control” • Conceptually simple: Limit the buildup of queues on the airport surface by controlling the pushback times of aircraft • If number of aircraft in movement area > Nctrl • Add any departing aircraft that requests clearance to a virtual departure queue, unlessthere is an aircraft waiting to use the gate, in which case, clear departure for pushback • If number of aircraft in movement area ≤ Nctrl • Clear aircraft in virtual departure queue for pushback in FCFS order, unlessthere is a flight waiting to use the gate of an aircraft in the virtual departure queue, in which case, clear departure for pushback Pushback requests Pushback clearances Departure throughput (Virtual) pushback queue for N-control Departure queue Ramp and taxiway interactions Runway
Effect of stopping and starting while taxiing • Potential fuel burn impact from stopping on the surface No significant impact
Effect of stopping and starting while taxiing • Impact depends on pilot actions No significant change in thrust setting thrust setting (%)
Using CFDR data to estimate impact of different taxi profiles • ICAO emissions databank assumes that aircraft taxi at a constant thrust setting of 7% • Using CFDR data (from Swiss Air) corresponding to taxi profiles of various aircraft, we • Developed a regression model for fuel burn, that considers the baseline fuel burn and the impact of stop-start events • Stop-start impact: Estimate of the form “The extra fuel burn from a start-stop event is equivalent to x additional minutes of taxi time” • Developed a (linear) regression model between fuel burn and thrust settings • Conducted above analysis for 9 aircraft types Fuel burn / √Temp = Baseline fuel burn rate*(taxi time) + (Stop-start impact)*(# of stop-start events)
CFDR estimates vs. ICAO fuel burn rates Labels indicate thrust settings; ICAO assumes 7% constant thrust during taxi. 5.9% 6.3% 1.6% 4.0% 4.1% 9.9% 7.4% 8.8% 27.4% [Khadilkar, Balakrishnan & Reynolds, working paper, 2010]
Results of CFDR analysis • Taxi time is by far the dominating factor in determining taxi fuel burn • Impact of stops and turns appears to be due to the increase in taxi time, rather than due to a significant change in the fuel burn rate • The majority of fuel consumed during stops appeared to be due to the additional time, rather than the application of breakaway power; the exact estimates varied (depending on aircraft type) from 3%-15% of the average fuel burn during a stop corresponding to the breakaway • In the data set considered (mostly from European airports), each stop appeared to add on average 2 min to the taxi time, while each turn added on average 20 seconds [Khadilkar, Balakrishnan & Reynolds, working paper, 2010]
Comparison of CFDR and surface surveillance data • Hybrid estimation to filter surface tracks • Compare time spent in different taxi modes ASDE-X data is only from BOS; CFDR is from mostly European and a few US airports
Predictive model for routing • Can we build a model of the airport surface that allows us to predict taxi times and recommend taxi routes? Take-offs from Node 7 At first node in path Mean error: -32 sec, stdev: 141 sec At second node in path Mean error: -4sec, stdev: 121 sec
Mitigating the impact of weather on air traffic operations • Objectives: • More flexible and dynamic trajectories • Increase efficiency of operations • Increase operational robustness in the presence of weather • Routing flexibility increases capacity • E.g., can we find a route within B km of original route that does not pass through weather Forecast Actual B [Michalek and Balakrishnan, ATM R&D Seminar 2009]
Dynamic fix relocation: 60-min ahead Pilots typically assumed to avoid Level 3+ weather
Dynamic fix relocation: 60-min ahead Pilots typically assumed to avoid Level 3+ weather
Dynamic fix relocation: 60-min ahead Pilots typically assumed to avoid Level 3+ weather
Dynamic fix relocation: 60-min ahead Pilots typically assumed to avoid Level 3+ weather
Dynamic fix relocation: 60-min ahead Pilots typically assumed to avoid Level 3+ weather
Dynamic fix relocation: 60-min ahead Pilots typically assumed to avoid Level 3+ weather
Dynamic fix relocation: 60-min ahead Pilots typically assumed to avoid Level 3+ weather
Dynamic fix relocation: 60-min ahead Pilots typically assumed to avoid Level 3+ weather
Resectorizationand rerouting/relocating fix • Multi-objective optimization: Maximize probability of fixes being open; minimize movement of sector boundary; minimize deviation of route from procedural route; try to keep all sectors open Observed Forecast Legend New Sector boundary Old sector boundary New Fix Old Fix CADIT CADIT WHINZ WHINZ DOOLY DOOLY ROME ROME SINCA GEETK SINCA GEETK BRAVS BRAVS LAGRANGE LAGRANGE Pilots typically assumed to avoid Level 3+ weather
Summary statistics of resectorization (fix/route relocation) Note that these metrics do not reflect the probability with which fix was predicted to be open. [Michalek and Balakrishnan, CDC 2010]
Summary statistics of resectorization (fix/route relocation) [Michalek and Balakrishnan, CDC 2010]
Pilot behavior • Of course, pilots do occasionally penetrate weather today • Can provide additional flexibility • Can we identify the factors that determine their behavior? “Really bad weather day” “3 Weather days”
Conclusions • Air transportation system presents many important problems that require the development of CPS methodologies • Solutions have the potential to increase system efficiency (reduce delays), robustness and energy efficiency (reduce fuel burn), and decrease environmental impact • Key objectives should include • More dynamic, flexible trajectories (and system structure) • Multi-objective control and balancing of tradeoffs • More decentralized decision-making