Download
1 / 21
210 likes | 395 Views
Timing in Thick Silicon Detectors. Andrej Studen, University of Michigan, CIMA collaboration. Outline. Motivation Timing in pad detectors Two intuitive solutions Comparison to measured data Where to go from here. Motivation.

E N D
Timing in Thick Silicon Detectors Andrej Studen, University of Michigan, CIMA collaboration
Outline • Motivation • Timing in pad detectors • Two intuitive solutions • Comparison to measured data • Where to go from here
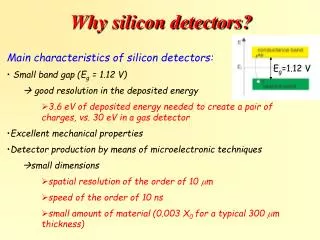
Motivation • Thick silicon detectors improve efficiency for gamma-ray detection. • In a coincident setup (PET, Compton camera) good timing resolution is required. • Experimental data not promising [1]. • Could it be compensated by different readout strategy and bias conditions? [1] N. Clinthorne et al. Timing in Silicon Pad Detectors for Compton Cameras and High Resolution PET; IEEE NSS/MIC, Portoriko, 2006
Model application • Silicon pad sensors used in Compton & silicon PET experiments at UofM: • p+-n-n+, 256/512 pads • Pad size 1.4 x 1.4 mm2, • Thickness: 1 mm, • FDV: 150 V (!), • ASIC: VATAGP3: • Charge sensitive pre-amplifier • CR-RC shaper with 200 ns shaping time. • Leading edge discriminator.
holes gamma-ray Recoil electron ~100 um (E gamma) electrons Compton scattering or photo-absorption Signal formation in a pad detector Readout electrode - P-side • Charge q moving in electric field induces current pulse on readout electrode: • Signal shape depends on: • Electric field • Ramo field • Interaction depth N-side +
Low field region. Charges move slowly. P-n junction. Large field region. Charges are fast. Electric field • Thickness (1mm) « lateral dimension (12/24 mm by 48 mm).
Low field region. Charges contribute less. Large Ramo field. Large contribution to current pulse. Ramo Field • Pad size ~ depth. • Asymmetry.
Interaction depth • Two regions: • Near region: • Large E field, • Large Ramo, • Fast rise-time. • Far region: • Small E field, • Small Ramo, • Slow rise-time. • Very sensitive because of short electron path. Asymmetry of both fields works against us.
Trigger time shift Leading edge trigger Preamp, CR-RC; t=200 ns Example: single e-h pair at pad edge, 1.4 VFD Far region fZ=0.9 Detector Near region fZ=0.1
Solution 1:Adding adjacent pads • Reducing Ramo asymmetry. • Noise of 9 pads added – jitter increased 3 x
Solution 2:Increasing bias • Much shorter times w/ higher bias • Often unpractical
Simulation overview • GEANT4 used to generate “true” paths of recoil electrons • 661 keV photons; 137-Cs (also measured) • Voltages from 200 V -> 400 V • Both single and summed pads
Results overview • Threshold: • 15 keV (experiment). • Time-walk: • Dominates below ~ 100 keV: • Could be compensated by appropriate readout strategy. • Three levels assumed for illustrative purposes.
Sharp edge Blunt edge Spurious tail Comparison to measurements • Measured in Compton mode (PMT start, silicon stop; PMT timing resolution ~ 10 ns)
Comparison, U=400 V • Simulation marginally better, measurement data more symmetric. Spurious tail gone.
Solution simulation RAMO 9 pads 200 V BIAS 400 V 1 pad
Latest greatest • Do both!
Conclusions • Shape of Ramo field has a significant influence on timing in thick silicon detectors. • Solutions: • Multi-pad readout (noise!), • Different detector geometries (strips?) • Different trigger strategies. • Operate at higher bias voltages.
Backup slides subtitle
70 ns 60 ns 50 ns 40 ns 30 ns 20 ns Illustration of depth-related trigger time variation • 15 % trigger, 1.4 VFD Single pad 9 pad sum
Illustration (cont’d) • 15% threshold, 1.4 VFD Single Pad 9 pad sum