Download
1 / 21
210 likes | 378 Views
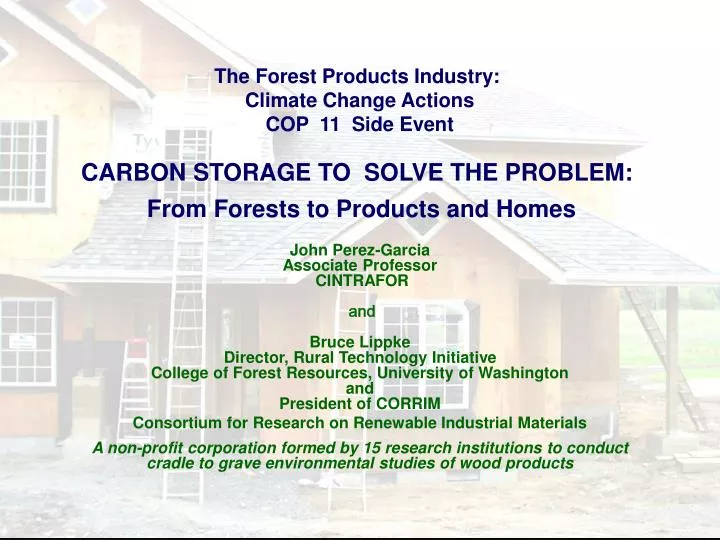
The Forest Products Industry: Climate Change Actions COP 11 Side Event CARBON STORAGE TO SOLVE THE PROBLEM: From Forests to Products and Homes. John Perez-Garcia Associate Professor CINTRAFOR and Bruce Lippke Director, Rural Technology Initiative

E N D
The Forest Products Industry: Climate Change Actions COP 11 Side EventCARBON STORAGE TO SOLVE THE PROBLEM:From Forests to Products and Homes John Perez-Garcia Associate Professor CINTRAFOR and Bruce Lippke Director, Rural Technology Initiative College of Forest Resources, University of Washington and President of CORRIM Consortium for Research on Renewable Industrial Materials A non-profit corporation formed by 15 research institutions to conduct cradle to grave environmental studies of wood products
How to store more carbon and emit less? • Trees convert atmospheric carbon into wood • The forest is a carbon storehouse (a carbon pool) • A solar energy storage unit • Can be burned for heat value • Can be converted into products • Both reduce fossil emissions. • Renewable - - as we use wood we also replant trees that replace the forest carbon unlike our use of fossil fuels
Life Cycle Assessment of Wood Products & Buildings CO Air Emissions O CO O 2 2 2 2 SUN Log Log Construction Production Management & Harvest Water & Land Emissions
How to store more forest carbon? • US Forests store 11 billion tonnes of carbon • Declining acres from urban sprawl • Increasing volume (biomass/carbon) • reforestation • management • conversion of agriculture land
Forest contributions to carbon storage: (1) the forest pool • PNW Forests store more carbon than other regions • Bigger trees on longer rotations and unmanaged old-forests • 29 tonnes/acre ave. in PNW commercial forest on 45 yr rotation • 76 tonnes/acre ave. if not disturbed for 125 yrs
Carbon in Forest Pools 80-Year Rotation with Two Thinnings
Carbon in Forest Pools 45 and 80-Year Rotation
Forest contributions to carbon storage: (2) the product pools • PNW Forests store more carbon than other regions • Bigger trees on longer rotations and unmanaged old-forests • 29 tonnes/acre average in PNW commercial forest • Commercial forests produce long lived products and store carbon in buildings • 24.5 tonnes/acre average in 120 years and growing
Carbon in Product Pools Processing Energy and Displacement
Forest contributions to carbon storage: (3) the substitution for fossil intensive products pool • PNW Forests store more carbon than other regions • Bigger trees on longer rotations and unmanaged old-forests • 29 tonnes/acre average in PNW commercial forest • Commercial forests produce long lived products and store carbon in buildings • 24.5 tonnes/acre average in 120 years and growing • Long lived wood products substitute for fossil fuel intensive products • 51.2 tonnes/acre less carbon emissions from less steel/concrete framing
Forest Resources & Harvesting PNW and SE • Processing of Structural Materials • PNW and SE • Lumber • Plywood • Glulam • LVL • I-joists • OSB (SE only) “Gate-to-Gate” • Construction of Virtual Residential Buildings to Code • Minneapolis wood and steel designs • Atlanta wood and concrete designs Building Use and Maintenance Disposal or Recycle Life Cycle Inventories: measure all inputs & outputs “Cradle” Emissions Effluents Solid Waste Products Co-products Materials Energy “Grave” Water
Input & Output Surveys conducted on 20 product processing and housing life stages Pacific NorthwestWood Production Minneapolis House Cold Climate Atlanta House Warm Climate Southeast Wood Production
Houses Designed to Local Code Wood vs. steel framed house designed to same R code. Concrete basement, sheetrock, insulation, wood trusses, vinyl windows, vinyl siding and asphalt roofing. Minneapolis House Cold Climate Wood framed vs. concrete block exterior walls designed to same R code. Slab on grade, sheetrock, insulation, wood trusses, vinyl windows, stucco/vinyl siding and asphalt roofing. Atlanta House Warm Climate
Summary Performance Indices Atlanta House vs. Above-grade Wall
Forest, Product and Substitution Pools Forest, Product and Substitution Pools
Carbon in Forests, Productsand Concrete Frame Substitutes Carbon in Forests, Productsand Concrete Frame Substitutes Averages over time intervals
Forest fires release emissions with no savings in fossil fuel and retard regeneration of the forest.
Conclusions • We can assess the environmental performance of products in buildings. • There are many potential improvements by using less fossil intensive products and more wood products . • Energy for heat production remains the driving factor in wood processing energy, but most could be bioenergy (if fuel costs were higher). • Short rotations with intensive management store the most carbon across all stages of processing. • Wood used in long term products provides the greatest reduction in fossil fuel use & emissions. • Forest fires reduce carbon storage, a lost opportunity to reduce fossil fuel uses.
Support Acknowledgements • CORRIM- Consortium for Research on Renewable Industrial Materials • 15 research institutions and 23 authors • DOE & 5 companies funded the Research Plan • USFS/FPL, 10 companies & 8 institutions funded Phase I • PNW & SE product manufactures surveyed • USDA/CSREES National Research Initiative competitive grants program • EPA & Special grants for carbon links