Download
1 / 19
190 likes | 327 Views
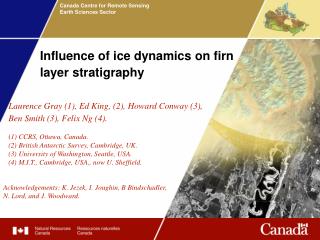
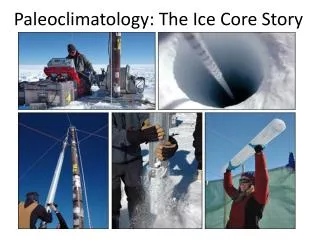
Melt Layer Analysis of Eclipse Ice Core 2002. Tom Daigle: Union College Cameron Wake: University of New Hampshire Supported by: NASA/UNH Research and Discover and NSF-OPP. Overview. Improve limited ice core record from NW Canadian Arctic

E N D
Melt Layer Analysis of Eclipse Ice Core 2002 Tom Daigle: Union College Cameron Wake: University of New Hampshire Supported by: NASA/UNH Research and Discover and NSF-OPP
Overview • Improve limited ice core record from NW Canadian Arctic • Drill 4 cores (main 345 m) for analysis of trace metals (Pb, Hg, As, Cd, V), major ions (Na+, NH4+, K+, Mg2+, Ca2+, NO3-, SO42-), oxygen isotopes, melting • Melt percent is increasing
Quick Terminology • Snow-Has not changed much since it fell • Firn-Transformed and compacted snow with open air bubbles • Firn/Ice Transition-Air bubbles close off and firn becomes glacial ice • Glacial Ice-Begins at depth where air bubbles close off, no more gas exchange w/ atmosphere Increasing age with depth
Glaciers Record Detailed Climatic History • Provide high resolution well dated records • Temperature (18O) • Precipitation chemistry (ions and trace metals) • Atmospheric circulation (ions, dust) • Trace gases (CO2, CH4, N2O) • Melt % is indicator of summer warmth Fisher and Koerner (Fisher and Koerner, 1993)
The Region 3017 m 5959 m
160 m firn/ice core Major ion and 18O analysis Developed accurate depth-age scale First record from this area at mid-altitudes Main Core 345 m 3 Primary objectives Trace element depositional history Atmospheric circulation reconstruction Understand environmental change in the region Eclipse 1996Eclipse 2002
My Role and Methods • Physical stratigraphy of 2 cores • Core 3-130 m Core 4-40 m Core 2-345 m (to be done later) • Measure each feature over a light table Firn Melt layers
3 Features were present and labeled Firn-Any non melt feature Mix-Any partial melt feature Ice-Any melt layer Mass measured and density calculated Density-depth profile Methods and Density Thick melt layer Firn/Ice transition
Each feature must be converted to its depth in water equivalent (WE) Current depth-age scale using 1996 1.38m WE/yr avg accum. 105 m 1.38m/y With isotopic and ionic analysis we can resolve an annual depth-age relationship Preliminary Depth-age Relationship = 76 years
Correlation Between Cores • Good correlation between cores 3 and 4 • Suggests it’s a true climatic signal • Core 3 1985 melt anomaly is not entirely climatic… • …Localized ice pipe or pool?
Trends Over Time • Overall melt is increasing • Suggests regional temperature is increasing • Warm periods in mid ’60’s, mid ’80’s, early and late ’90’s
Trends Over Time Smoothed Data • More variability over past 40 years • More pronounced extremes • Greater deviations from the avg. trend Residual Ice Percent
Relationship to Regional Temperature • Increased surface melting should correlate with warmer regional temperatures • US Global Change Research Program shows increase in Alaskan temps
Climate in the Region is Warming • Northwestern NAM is warming • USGCRP reports 2°C warming in Alaska since 1950 • Daily and weekly extremes are likely causing increased melt percentages • Recent more frequent extreme highs (melting) does reflect overall warming trend http://www.usgcrp.gov/usgcrp/Library/nationalassessment/overviewalaska.htm
Melt Layers and Climate • Fisher and Koerner showed that melt percent provides a record of regional summer temperature • The 130 m, 76 year Eclipse 2002 record reveals increased melting indicating increased regional temperatures
Melt Layers and Climate • More accurate dating and correlation with isotopic and ionic records from core 2 will improve this experiment • Higher resolution temperature data is needed to identify unusually high melt years • Waiting on Historical Climatology Network daily temperature data
Thank you: Cameron Wake Sarah Story Kaplan Yalcin George Hurtt Mark Twickler Jack Dibb Barry Keim Kevan Carpenter NASA/UNH Research and Discover
Resources: • Fisher, DA and Koerner, RM, Signal and noise in four ice-core records from the Agassiz Ice Cap, Ellesmere Island, Canada: details of the last millennium for stable isotopes, melt and solid conductivity The Holocene, 4, 113-120, 1995. • Koerner, RM and Fisher, DA, A record of Holocene summer climate from a Canadian high-Arctic ice core, Nature, 343 630-631, Feb 1990. • Paterson, WSB, The Physics of Glaciers 2nd Edition, Pergamon Press, NY, 1981, pgs 5-20. • Wake, CP, and others, The climate signal recorded in the oxygen isotope, accumulation, and major ion time-series from the Eclipse ice core, Yukon Territory, Annals of Glaciology, 35, 2002 • Wake, CP, Eclipse 2002 research proposal • Weller, G, and others, US Global Change Research Program, US National Assessment of the Potential Consequences of Climate Variability and Change Mega-Region: Alaska Dec 1999 • Yalcin, K, and Wake, CP, Anthropogenic signals recorded in an ice core from Eclipse Icefield, Yukon Territory, Canada, Geophysical Research Letters, 28, 4487-4490, Dec 2001. • Yalcin, K, Anthropogenic and volcanic signals in an ice core from Eclipse Icefield, Yukon Territory, Canada, UNH MS Thesis, 2001