Download
1 / 59
740 likes | 1.35k Views
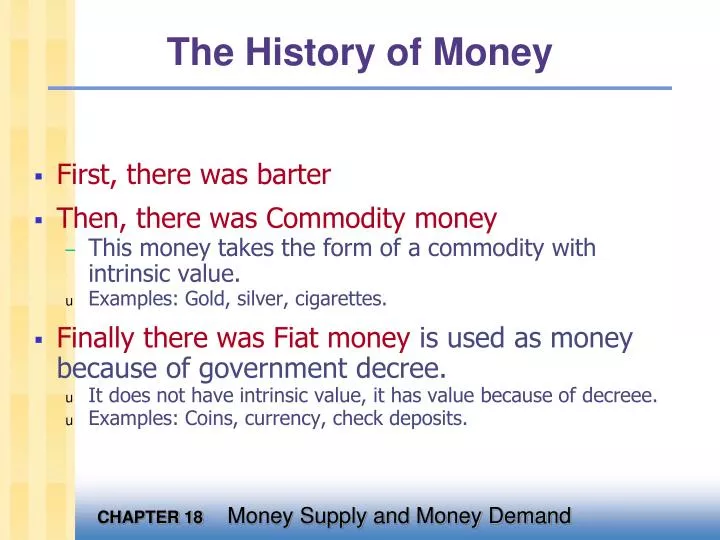
The History of Money. First, there was barter Then, there was Commodity money This money takes the form of a commodity with intrinsic value. Examples: Gold, silver, cigarettes. Finally there was Fiat money is used as money because of government decree.

E N D
The History of Money • First, there was barter • Then, there was Commodity money • This money takes the form of a commodity with intrinsic value. • Examples: Gold, silver, cigarettes. • Finally there was Fiat moneyis used as money because of government decree. • It does not have intrinsic value, it has value because of decreee. • Examples: Coins, currency, check deposits.
The Meaning of Money Money is the set of assets in the economy that people regularly use to buy goods and services from other people.
Three Functions of Money • Money has three functions in the economy: • Medium of exchange • Unit of account • Store of value
Money in the U.S. Economy • Currencyis the paper bills and coins in the hands of the public. • Demand depositsare balances in bank accounts that depositors can access on demand by writing a check.
Amount in 1998 Measure What’s Included M1 Currency $1,092 billion Traveler’s checks Demand deposits Other checkable deposits M2 Everything in M1 $4,412 billion Saving deposits Small time deposits Money market mutual funds A few minor categories Money in the U.S. Economy NOTE: M3 = M2 + Large Time Deposits
Banks’ role in the money supply • The money supply equals currency plus demand (checking account) deposits: M = C + D • Since the money supply includes demand deposits, the banking system plays an important role.
A few preliminaries • Reserves (R): the portion of deposits that banks have not lent. • To a bank, liabilities include deposits, assets include reserves and outstanding loans • 100-percent-reserve banking: a system in which banks hold all deposits as reserves. • Fractional-reserve banking: a system in which banks hold a fraction of their deposits as reserves.
SCENARIO 1: No Banks With no banks, D = 0 and M = C = $1000.
FIRSTBANK’S balance sheet Assets Liabilities SCENARIO 2: 100 Percent Reserve Banking • After the deposit, C = $0, D = $1000, M = $1000. • 100% Reserve Banking has no impact on size of money supply. • Initially C = $1000, D = $0, M = $1000. • Now suppose households deposit the $1000 at “Firstbank.” reserves $1000 deposits $1000
FIRSTBANK’S balance sheet Assets Liabilities SCENARIO 3: Fractional-Reserve Banking The money supply now equals $1800: The depositor still has $1000 in demand deposits, but now the borrower holds $800 in currency. • Suppose banks hold 20% of deposits in reserve, making loans with the rest. • Firstbank will make $800 in loans. reserves $1000 deposits $1000 reserves $200 loans $800
FIRSTBANK’S balance sheet Assets Liabilities SCENARIO 3: Fractional-Reserve Banking The money supply now equals $1800: The depositor still has $1000 in demand deposits, but now the borrower holds $800 in currency. Thus, in a fractional-reserve banking system, banks create money. deposits $1000 reserves $200 loans $800
SECONDBANK’S balance sheet Assets Liabilities SCENARIO 3: Fractional-Reserve Banking • But then Secondbank will loan 80% of this deposit • and its balance sheet will look like this: • Suppose the borrower deposits the $800 in Secondbank. • Initially, Secondbank’s balance sheet is: deposits $800 reserves $800 loans $0 reserves $160 loans $640
THIRDBANK’S balance sheet Assets Liabilities SCENARIO 3: Fractional-Reserve Banking • If this $640 is eventually deposited in Thirdbank, • then Thirdbank will keep 20% of it in reserve, and loan the rest out: deposits $640 reserves $640 loans $0 reserves $128 loans $512
Finding the total amount of money: Original deposit = $1000 + Firstbank lending = $ 800 + Secondbank lending = $ 640 + Thirdbank lending = $ 512 + other lending… Total money supply = (1/rr) $1000 where rr = ratio of reserves to deposits In our example, rr = 0.2, so M = $5000
This T-Account shows a bank that… accepts deposits, keeps a portion as reserves, and lends out the rest. It assumes a reserve ratio of 10%. First National Bank Assets Liabilities Reserves $10.00 Loans $90.00 Deposits $100.00 Total Assets $100.00 Total Liabilities $100.00 Money Creation
First National Bank Second National Bank Assets Liabilities Assets Liabilities Reserves $10.00 Loans $90.00 Deposits $100.00 Reserves $9.00 Loans $81.00 Deposits $90.00 Total Assets $100.00 Total Liabilities $100.00 Total Assets $90.00 Total Liabilities $90.00 Money Creation Money Supply = $190.00!
Original deposit = $ 100.00 First National lending = $ 90.00 [=0.9 x $100.00] Second National lending = $ 81.00 [=0.9 x $90.00] Third National lending = $ 72.90 [=0.9 x $81.00] ¯ ¯ Total money supply = $1,000 The Money Multiplier How much money is eventually created in this economy?
Money creation in the banking system A fractional reserve banking system creates money, but it doesn’t create wealth: bank loans give borrowers some new money and an equal amount of new debt.
Three instruments of monetary policy • Open market operations • Reserve requirements • The discount rate/federal funds rate
Open market operations • definition: The purchase or sale of government bonds by the Federal Reserve. • how it works:If Fed buys bonds from the public, it pays with new dollars, increasing B and therefore M. • Recession – Buy Bonds – Big Bucks • Inflation – Sell Bonds – Small Bucks
Reserve requirements • definition: Fed regulations that require banks to hold a minimum reserve-deposit ratio. • how it works:Reserve requirements affect rr and m: If Fed reduces reserve requirements, then banks can make more loans and “create” more money from each deposit. • Recession – lower reserve requirements • Inflation – higher reserve requirements
Discount Rate and Federal Funds Rate • discount rate definition: The interest rate that the Fed charges on loans it makes to banks. • federal funds rate definition: The interest rate that the banks charges on loans it makes to other banks • how it works:When banks borrow from the Fed, their reserves increase, allowing them to make more loans and “create” more money. The Fed can increase B by lowering the discount and federal funds to induce banks to borrow more reserves from the Fed.
Which instrument is used most often? • Open market operations: Most frequently used. • Changes in reserve requirements: Least frequently used. • Changes in the discount rate and federal funds rate: Most publicized
The Demand for Money The Influences on Money Holding • The quantity of money that people plan to hold depends on four main factors: • The price level • The interest rate • Real GDP • Financial innovation
The Demand for Money: Price Level • A rise in the price level increases the nominal quantity of money but doesn’t change the real quantity of money that people plan to hold. • Nominal money is the amount of money measured in dollars. • The quantity of nominal money demanded is proportional to the price level — a 10 percent rise in the price level increases the quantity of nominal money demanded by 10 percent.
The Demand for Money: Interest Rate • The Interest Rate • The interest rate is the opportunity cost of holding wealth in the form of money rather than an interest-bearing asset. • A rise in the interest rate decreases the quantity of money that people plan to hold. • Real GDP • An increase in real GDP increases the volume of expenditure, which increases the quantity of real money that people plan to hold.
The Demand for Money • Financial innovation • Financial innovation that lowers the cost of switching between money and interest-bearing assets decreases the quantity of money that people plan to hold.
The Demand for Money Curve • The demand for money curve is the relationship between the quantity of real money demanded (M/P) and the interest rate when all other influences on the amount of money that people wish to hold remain the same.
The Demand for Money • Figure 6 illustrates the demand for money curve. • The demand for money curve slopes downward—a rise in the interest rate raises the opportunity cost of holding money and brings a decrease in the quantity of money demanded, which is shown by a movement along the demand for money curve.
Shifts in the Demand for Money Curve • The demand for money changes and the demand for money curve shifts if real GDP changes or if financial innovation occurs.
The Demand for Money Figure 7 illustrates an increase and a decrease in the demand for money. A decrease in real GDP or a financial innovation decreases the demand for money and shifts the demand curve leftward. An increase in real GDP increases the demand for money and shifts the demand curve rightward.
Interest Rate Determination • An interest rate is the percentage yield on a financial security such as a bond or a stock. • The price of a bond and the interest rate are inversely related. • If the price of a bond falls, the interest rate on the bond rises. • If the price of a bond rises, the interest rate on the bond falls. • We can study the forces that determine the interest rate in the market for money.
Money Market Equilibrium • The Fed determines the quantity of money supplied and on any given day, that quantity is fixed. • The supply of money curve is vertical at the given quantity of money supplied. • Money market equilibrium determines the interest rate.
Interest Rate Determination Figure 9 illustrates the equilibrium interest rate.
Interest Rate Determination • If the interest rate is above the equilibrium interest rate, the quantity of money that people are willing to hold is less than the quantity supplied. • They try to get rid of their “excess” money by buying financial assets. • This action raises the price of these assets and lowers the interest rate.
Interest Rate Determination • If the interest rate is below the equilibrium interest rate, the quantity of money that people want to hold exceeds the quantity supplied. • They try to get more money by selling financial assets. • This action lowers the price of these assets and raises the interest rate.
Changing the Interest Rate • Figure 10 shows how the Fed changes the interest rate. • If the Fed conducts an open market sale, the money supply decreases, the money supply curve shifts leftward, and the interest rate rises.
Interest Rate Determination If the Fed conducts an open market purchase, the money supply increases, the money supply curve shifts rightward, and the interest rate falls.
Ripple Effects of Monetary Policy • If the Fed increases the interest rate, three events follow: • Investment and consumption expenditures decrease. • The dollar rises and net exports decrease. • A multiplier process unfolds.
Monetary Policy, Real GDP,and the Price Level Figure 11 summarizes these ripple effects.
Monetary Policy in the AS-AD Model Figure 12 illustrates the attempt to avoid inflation.
Monetary Policy, Real GDP,and the Price Level The decrease in investment shifts the AD curve leftward with a multiplier effect in part (c).
Monetary Policy, Real GDP,and the Price Level Figure 13 illustrates the attempt to avoid recession.
Monetary Policy, Real GDP,and the Price Level The increase in investment shifts the AD curve rightward with a multiplier effect in part (c).
The Market for Loanable Funds • The loanable funds market is a hypothetical market that examines the market outcome of the demand for funds generated by borrowers and the supply of funds provided by lenders. • The interest rate is the price, calculated as a percentage of the amount borrowed, charged by the lender to a borrower for the use of their savings for one year.
The Meaning of Saving and Investment • Private saving is the income remaining after households pay their taxes and pay for consumption. • Examples of what households do with saving: • Buy corporate bonds or equities • Purchase a certificate of deposit at the bank • Buy shares of a mutual fund • Let accumulate in saving or checking accounts
The Meaning of Saving and Investment • Investment is the purchase of new capital. • Examples of investment: • General Motors spends $250 million to build a new factory in Flint, Michigan. • You buy $5000 worth of computer equipment for your business. • Your parents spend $300,000 to have a new house built. Remember: In economics, investment is NOT the purchase of stocks and bonds!
The Market for Loanable Funds • A supply-demand model of the financial system • Helps us understand • how the financial system coordinates saving & investment • how govt policies and other factors affect saving, investment, the interest rate
The Market for Loanable Funds Assume: only one financial market • All savers deposit their saving in this market. • All borrowers take out loans from this market. • There is one interest rate, which is both the return to saving and the cost of borrowing.