Download
1 / 11
110 likes | 124 Views
We researched the highest dividend paying REIT Stock of Bursa Malaysia which is being overlooked by investors. Follow- https://www.mmfsolutions.my/

E N D
HEKTAR REAL ESTATE INVESTEMENT TRUST Hektar Real Estate Investment Trust is Malaysia’s first retail-focused REIT COMPANY PROFILE KEY FINANCIAL RATIOS Hektar Real Estate Investment Trust (Hektar REIT) is a Malaysia-based retail-focused real estate investment trust (REIT). The Trusts principal activity is to invest primarily in retail assets with the objective of achieving an attractive level of return from rental income, as well as for long-term capital growth. It invests in real estate primarily used for retail purposes. Hektar REIT's portfolio consists of shopping centers situated in Subang Jaya, Melaka, Muar, Sungai Petani and Kulim. Subang Parade was a regional shopping center in Selangor. The center is located in the heart of Subang Jaya's commercial district. Mahkota Parade is a regional shopping center located in the commercial and tourist center situated in the heart of Melaka town. Wetex Parade is an integrated retail development located within the commercial district of Muar, Johor. The Trust is managed by Hektar Asset Management Sdn. Bhd. Financial Statistics Returns on Similar Instruments Income Distributions Source: Annual Reports
management and brand names of the REITs, in addition to shopping complexes becoming one- stop centers, providing food and beverages and entertainment options,” stated the research house. Market Overview: Retail Industry The challenges within the retail industry and the overall economy remain in the spotlight for investors. The World Bank has lowered Malaysia’s Based on Bloomberg data, the Bursa Malaysia REIT Index’s dividend yield has declined over the last few months, from 5.46% in February this year to 5.28% as of July 16. The REIT Index’s dividend yield has been on a downtrend as prices for some of the listed REITs have risen. The yield goes down whenever the market prices show uptrend. economic growth projection to 4.7% for 2019 while the Malaysian Retail Chain Association targets retail sales growth of 5% in 2019. The subdued forecasts are in line with the sentiment of uncertainty arising from global macroeconomic trends. The challenges within the Eurozone, the Year to date, the REIT Index has outperformed the benchmark FBM KLCI. The REIT Index has increased by 8.25% since January, while FBM KLCI declined by 1.28%. The REIT Index’s 12-month trailing price-to-earnings ratio stood at 20.60 times. prospect of a messy BREXIT and the US-China Trade War have all contributed to an atmosphere of volatility. In general, the retail industry continues to undergo a structural change, with the inexorable Hektar REIT: Latest News growth of online retail spending shifting consumer consumption patterns. Coupled with the rise of In an interview to Star Online, Hektar Asset Management Sdn Bhd executive director and CEO Datuk Hisham Othman said that the Reit’s strategy is to own geographically diverse malls that are yield accretive. Hektar Reit considers retail properties with yields of 6% to 7% to be acceptable. This strategy has been proven well, and the future malls that company acquire will most likely be situated outside the Klang Valley, which is saturated with overbuilt malls or retail assets. Apart from that, Hektar Reit takes into consideration the percentage of ownership, land title status and tenure of the retail assets it looks to acquire. social influencers, online retailing continues to impact certain categories of retailers. Overall, the new government policies and the realities of the new online economy have served to positively impact the retail sector management thinking and strategy of going forward. Malaysian REIT Sector Outlook According to AmInvestment Bank Research, the Malaysian REITs sector might face some turbulence in the near future.The outlook for retail properties, especially shopping malls, is expected to remain stable in the short to medium term. “This is demonstrated by Hektar REIT, Pavilion REIT and Sunway REIT whereby all have high occupancy rates in their shopping malls. AmInvestment Bank Research says that the high occupancy rates are also due to strong At present, there are six shopping centers with two million square feet of retail space, valued at RM1.2bil under the portfolio. and the REITs is on track to double its assets value to RM 2.4bil by 2026.
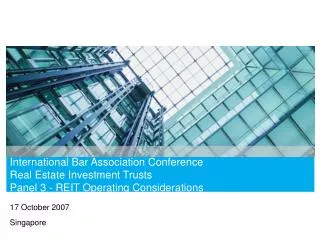
REIT Financials INCOME STATEMENT 2015 2016 2017 2018 Period Ending: 31/12 31/12 31/12 31/12 Total Revenue 125.51 124.57 125.54 135.11 Cost of Revenue, Total 49.03 50.24 51.81 56.39 Gross Profit 76.48 74.33 73.73 78.72 Selling/General/Admin. Expenses, Total 10.3 9.9 10.8 11.92 Other Operating Expenses, Total -0.31 -0.01 -0.05 -0.35 Operating Income 66.49 64.44 62.98 67.15 Interest Income (Expense), Net Non-Operating -61.73 -21.29 -30.3 -34.02 Net Income Before Taxes 4.76 43.15 32.68 33.13 Provision for Income Taxes 0 0 0 0 Net Income 4.76 43.16 32.7 33.13 Diluted Net Income 4.76 43.16 32.7 33.13 Diluted Weighted Average Shares 409.58 409.58 418.01 462.04 Diluted EPS Excluding Extraordinary Items 0.01 0.11 0.08 0.07 DPS - Common Stock Primary Issue 0.1 0.1 0.1 0.09 Diluted Normalized EPS 0.01 0.11 0.08 0.07 In Millions of MYR (except for per share items) 160 135.11 140 125.54 125.51 124.57 120 100 Total Revenue 80 67.15 66.49 64.44 Operating Income 62.98 60 Net Income 43.16 33.13 32.7 40 20 4.76 0 2015 2016 2017 2018 ❖Revenue reached RM135.1 million in 2018, up 7.6%. Operational expenses increased to RM56.4
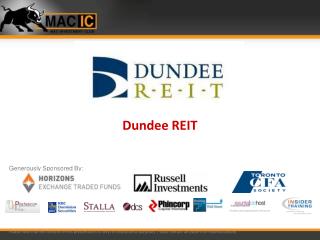
Million, up 8.9%. The resulting net property income reached approximately RM78.7 million, up 6.8%. ❖Realised net income before tax reached approximately RM42.3 million, an increase of 5.3% from the previous year. Borrowing costs also climbed to RM25.3 million, up 9.1%, reflecting a gradual rise in rates. ❖ Hektar REIT has declared its fourth quarter DPU at 2.31 sen, capping off the year at a total of 9.01 sen per unit. This is a decline of 6% from the previous year, owing to increases in the aforementioned costs. ❖In total, the distribution payout in 2018 is RM41.6 million, a slight increase of 2.8% due to the enlarged unit’s base in 2017. Hektar REIT continues to provide a stable dividend track record, paying more than 90% of its net income to unitholders. Collectively, Hektar REIT has paid more than RM452.6 million in dividends to unitholders since 2006. BALANCE SHEET 2015 2016 2017 2018 Period Ending: 31/12 31/12 31/12 31/12 28.76 38.59 41.01 39.06 Total Current Assets 1268.27 1252.36 1131.86 1116.31 Total Assets 68.98 47.34 38.16 37.63 Total Current Liabilities 632.96 603.49 546.39 531.94 Total Liabilities 635.32 648.87 585.47 584.38 Total Equity 1268.27 1252.36 1131.86 1116.31 Total Liabilities & Shareholders' Equity 461.96 461.96 409.58 409.58 Total Common Shares Outstanding In Millions of MYR (except for per share items) ❖Hektar REIT’s financing comprises Al-Murabahah overdraft facilities with a combination of term loan and floating rate facilities. In total, the facilities amount to RM563 million, providing Hektar REIT with a gearing ratio of 44.4%. Of this amount, RM15 million is a revolving credit facility renewable annually, RM30 million due in 2021 and the bulk of RM518 million due in 2024. The management is actively exploring a Medium Term Note programme to tap into the debt market.
1400 1200 1000 Total Assets 800 600 Total Liabilities 400 200 0 2015 2016 2017 2018 CASH FLOW STATEMENT 2015 31/12 2016 31/12 2017 31/12 2018 31/12 Period Ending: 12 Months 12 Months 43.16 12 Months 12 Months 33.13 Period Length: Net Income/Starting Line Cash From Operating Activities Cash From Investing Activities Cash From Financing Activities Net Change in Cash 4.76 32.7 68.54 49.76 76.9 83.59 -40.39 -2.98 -93.76 -26.89 -23.8 -51.3 24.4 -65.47 4.35 -4.53 7.54 -8.76 Cash From Operating Activities Chart Title 40 20 0 100 2015 2016 2017 2018 -20 80 -40 60 -60 40 -80 -100 20 Cash From Investing Activities 0 2015 2016 2017 2018 Cash From Financing Activities Source: MMF Solutions Internal Research
PORTFOLIO STRUCTURE Source: Annual Reports Still Confused: Stay Confusion Free with MVR RECOMMENDATION Malaysia is a great place to invest in REITs especially because it is one of the leading countries in South East Asia in terms of economic growth and development. The country’s REITs are considered among the best out of all the developing countries in the world. Although REITs are considered good investments, it is also important to factor in the risks that may be involved in particular types of REITs. The ideal REIT to invest in should feature dividends that increase over time. Also, make sure that the REIT you invest in has property located in strategic areas to maximize their revenue. The performance of a REIT also comes down to how well it will be managed. The management should thus include professional individuals that can handle the business in good and bad times.
Why Hektar REIT stands out to be an ideal investment • There are too many shopping malls in the Klang Valley. Retail space per capita in the Klang Valley increased from 7.3 to 9.2 square feet in 2018 and is expected to reach 10.5 square feet in 2020. Five out six shopping malls of Hektar REIT’s portfolio are located outside the Klang Valley. As at 31 December 2018, its portfolio of six malls has a total net lettable area (NLA) of 2 million square feet and an aggregate value of RM1.2 billion. The company is continuously paying a dividend payout out of 90% or more, also the company has distribution per unit (DPU) greater than 8% on annual basis for year ending 2018. Currently the company is paying a Distribution Yield of more than 9% the highest in the segment. The latest Malaysian REIT data verifies the statement. • • • Note: Low market prices also inflates Distribution yield Source: The Fifth Person Dividend per unit (DPU) decreased by 6.3% on a YOY basis to 9.0 sen in 2018. Although DPU reached a 10-year low in 2018, Hektar’s distribution yield still stood at around 8.1% as its share price has been on a downtrend since 2016. Total income distribution actually increased by 2.7% from RM40.5 million in 2017 to RM41.6 million in 2018, but the issuance of new units pushed the REIT’s DPU down. • •
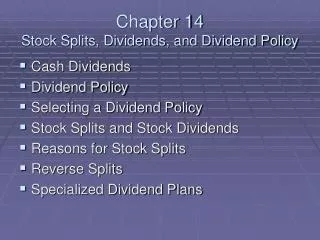
11 10.7 10.5 10.5 10.5 10.5 10.5 10.5 10.5 10.5 10.3 10.2 10 9.6 9.5 9.0 9 8.5 8 2007 2008 2009 2010 2011 2012 2013 2014 2015 2016 2017 2018 The Hektar REIT is trading at its lows which make the stock attractive to buy for long term holdings.
An investment of RM 100000 in Hektar REIT during 2007 has accumulated a wealth of RM 323353.62 in 12 years. Year Year Ending 2006 2007 2008 2009 2010 2011 2012 2013 2014 2015 2016 2017 2018 Rate of Return Amount in RM 0 1 2 3 4 5 6 7 8 9 -100000 110700 121991.40 134556.51 148684.95 164296.87 181548.04 200610.58 221674.69 244950.54 270670.34 296654.70 323353.62 10.70% 10.20% 10.30% 10.50% 10.50% 10.50% 10.50% 10.50% 10.50% 10.50% 9.60% 9.00% 10 11 12 Future value (FV) of principal investment of RM 100,000 after 12 years compounding annually at the rate of 10.28% per annum (average of last 12 years). ?????? ????? (??) = ??????? ????? (??) × (1 + ?)? Where •Present value = Principal Investment = RM 100,000 •r = rate of return = 10.28% •n = tenure of investment = 10 years ?????? ????? (??) = 100000 × (1 + 10.28%)12 ?? = ?? 323,389 Net Profit = 323389 -100000 ?? = ?? 223389
Disclaimer The material in this presentation has been prepared by fundamental & equity research team of Multi Management Future Solutions Malaysia. This is neither a recommendation to purchase or sell of the shares, securities or other instruments mentioned in this document or referred to; nor can this document be treated as professional advice to buy, sell or take a position in any shares, securities or other instruments. The information contained herein is based on the study and research of the Multi Management Future Solutions and are merely the written opinions and ideas of the Authors, and is as such strictly for educational purposes and/or for study or research only. This information should not and cannot be construed as or relied on and (for all intents and purposes) does not constitute financial, investment or any other form of advice. Any investment involves the taking of substantial risks, including (but not limited to) complete loss of capital. Every investor has different strategies, risk tolerances and time frames. You are advised to perform your own independent checks, research or study; and you should contact a licensed professional before making any investment decisions.