Download
1 / 30
300 likes | 431 Views
Overview of the 2007 Ohio Youth Risk Behavior Survey. Health Educators Institute October 13, 2010 Angie Norton, MA Ohio Department of Health School and Adolescent Health. Acknowledgements.

E N D
Overview of the 2007 Ohio Youth Risk Behavior Survey Health Educators Institute October 13, 2010 Angie Norton, MA Ohio Department of Health School and Adolescent Health
Acknowledgements Ohio’s 2007 Youth Risk Behavior Survey (YRBS) was administered by the Ohio Department of Health. The following agencies served as advisors to the project: • Ohio Department of Alcohol and Drug Addiction Services • Ohio Department of Mental Health • Ohio Department of Education
What is the YRBS? • Developed in 1990 by the Centers for Disease Control and Prevention (CDC) • The YRBS attempts to measure prevalence of behaviors that contribute to leading causes of death, disease and injury. • The survey is conducted every two years in grades 9 through 12.
What is the YRBS? • The Ohio survey tool is comprised of 99 multiple choice questions • 58 core questions from the CDC standard YRBS must remain unchanged • New questions that are added are reviewed by the CDC • Ohio has kept most questions unchanged resulting in trend data
History of Ohio’s YRBS • First conducted in 1993 by the Ohio Department of Education (ODE) • Subsequent surveys in 1995, which did not yield weighted data, 1997, 1999, 2003, 2005, 2007 and most recently 2009 (did not achieve weighted data) • In 2001 due to requests from Ohio legislature the survey was not completed • In 2003 YRBS administration moved to ODH
How is the Sample Selected? • August – October school data file is created with list of all eligible Ohio schools with 9 through 12 grades is compiled. • Sample size is decided upon by size of the eligible population, estimate of student response rate, desired precision of results and staff resources. • Survey administered January through May.
How is the Sample Selected? • Student response rate is determined by average daily attendance of students and parental consent. • Ohio utilizes passive consent unless a school district requests active consent • An overall response rate of 60% is needed for weighted data • Monetary incentives were used in 2003
How are students selected? • Students are selected by class • Each student must have an equal opportunity of selection • Classes which are required by all students are generally used such as English or 3rd period classes • Student identity remains anonymous
Who Participated in Ohio’s 2007 YRBS? • 136 schools were selected • 101 schools agreed to participate • 2,527 students in grades 9 – 12 completed surveys • School response rate = 75% • Student response rate = 81%
Benefits of the Ohio YRBS • 2007 weighted data represents what Ohio’s ninth through twelfth graders report of their current health habits • Larger sample in 2007 yielded data for Appalachia and Metro area comparisons Findings also assist in the following: • allocating limited resources • plan and implement programs • note progress or deficiencies
Challenges to Conducting the YRBS • Getting schools to say yes to participating • Agreeing on questions to place on the survey • Keeping questions over time to yield trend data • State resources to implement survey
Reporting the Results • Answers are only as accurate as student’s reporting • Some students choose not to answer some questions • Only questions with 100 or more responses are reported
Reporting the Results • Survey findings are valid at 95% confidence level • Percentages are rounded according to CDC guidelines • Ohio has trend data on 48 questions during 5 measurement periods over 17 years
injury violence mental health tobacco use alcohol /other drug use sexual behaviors nutrition physical activity preventive health care positive youth development Reporting the Results
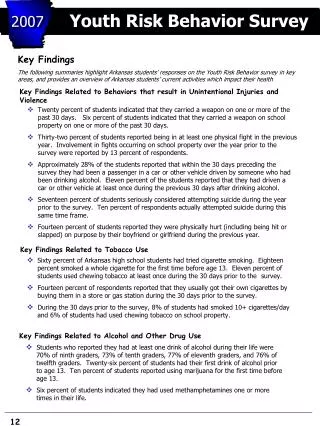
Highlights from the 2007 survey • 14.3% reported rarely or never wearing a seat belt when riding in a car • 22.8% reported riding in a car driven by someone who had been drinking • Significantly different from 31.9 % in 1999
Highlights from the 2007 survey • 16.6% of students carried a weapon in the last 30 days • 3.8% did not attend school (in last 30 days) due to feeling unsafe • Significant decrease from 1999 (8%) • 27.8% were harassed or bullied in last 12 months
Highlights from the 2007 survey • 30.4% were in a physical fight in last 12 months • Significant decrease from 1999 37.0% • 10.2% forced to have sexual intercourse when not wanted • Significant decrease for black students from 21% in 1999 to 9.8% in 2007
Highlights from the 2007 survey • 13.4% seriously considered suicide • Significant decrease from 20.3% in 1999 • 7.2% attempted suicide in last year • Significant decrease from 11.9 % in 2003 • 25% were so sad or hopeless they stopped doing usual activities
Highlights from the 2007 survey • 21.6% smoked cigarettes in last 30 days • Significant decrease from 40.3 % in 1999 • 48.6% of current smokers tried to quit smoking • 9.8% used smokeless tobacco in last 30 days
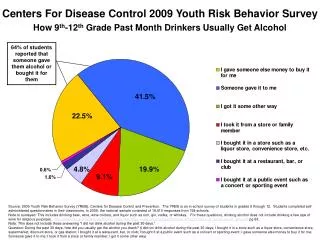
Highlights from the 2007 survey • 17.7% smoked marijuana in last 30 days • Significant decrease from 26.1% from 1999 • 45.7% drank alcohol in last 30 days • Significant decrease from 56% in 1999 • 28.8% reported binge drinking • Significant decrease from 37.4% in 1999
Highlights from the 2007 survey • 44.5% have had sexual intercourse • Of those, 60% used a condom at last intercourse
Highlights from the 2007 survey • 44.7% were physically active for a total of at least 60 minutes 5 days a week • 32% watched three or more hours of TV daily • 22.7% played video games or used the computer for fun three or more hours daily
Highlights from the 2007 survey • 15% are overweight (self-reported height and weight) • 30% described selves as slightly or very overweight
Comparisons of Adolescent Behaviors by County Type • Metropolitan county female students had higher odds of riding in a vehicle driven by someone who had been drinking alcohol than rural Appalachian students • No difference for males
Comparisons of Adolescent Behaviors by County Type • Among 10th grade students, Appalachian students had significantly higher odds of having had sexual intercourse than Metropolitan students • Appalachian students had higher odds of being physically active for a total of at least 60 on five or more of the past 7 days than Metropolitan students
Comparisons of Adolescent Behaviors by County Type • Metropolitan students had higher odds of having 100% fruit juice and having green salad at least once in the past seven days than Appalachian students
Relationships Between Risky Health Behaviors • Sexual Activity • Ohio students drinking alcohol or using drugs before their last sexual intercourse had 1.5 times lower odds of using a condom than students not drinking alcohol or using drugs before their last sexual intercourse
Comparisons of Adolescent Behaviors by County Type • The age at which alcohol consumption begins is strongly related to drinking and driving • Compared to adolescents who first drank at age 17 years or older, those who began at age 12 or younger had 4.7 times the odds of drinking and driving • Ohio students who had 5 or more drinks of alcohol within a couple of hours at least once in the past 30 days had 15.7 times higher odds of drinking and driving in the past 30 days
Comparisons of Adolescent Behaviors by County Type • Nutrition • Consumption of soda/pop in the past 7 days was not significantly associated with being overweight. • Students who were physically active for a total of at least 60 minutes per day on five or more of the past seven days had 1.7 times lower odds of being overweight • Students who watch three or more hours of television on an average school day had 1.6 being overweight than those who watched less TV
Contact Information Angie Norton Ohio Department of Health Angela.Norton@odh.ohio.gov