Download
1 / 18
180 likes | 312 Views
Memory Management. Version B.02 H4262S Module 6 Slides. Memory Management. Virtual Memory = Physical Memory + Swap Space. Swap Space. Virtual Memory. Memory. 1 F 1 1 1 F F F F F 1 F. 0 0 0 1 0 0 0 1 0 0 0 0. 1 0 0 0 0 1 0 0 0 0 0 0.

E N D
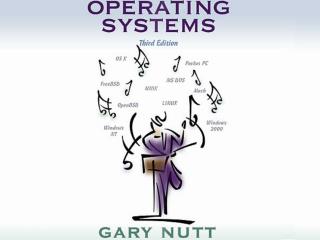
Memory Management Version B.02 H4262S Module 6 Slides
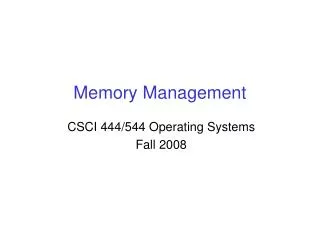
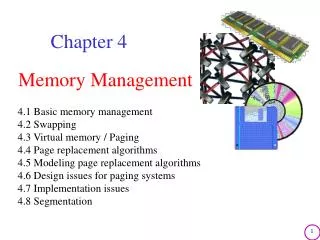
Memory Management Virtual Memory = Physical Memory + Swap Space Swap Space Virtual Memory Memory
1 F 1 1 1 F F F F F 1 F 0 0 0 1 0 0 0 1 0 0 0 0 1 0 0 0 0 1 0 0 0 0 0 0 0 0 0 0 0 0 0 0 0 0 0 1 0 0 1 0 0 0 0 0 1 0 0 0 0 0 0 0 0 0 1 0 0 0 0 0 0 0 0 0 0 0 0 0 0 0 0 0 1 1 1 1 1 1 1 1 1 1 1 1 1 1 1 1 1 1 1 1 1 1 1 1 1 1 1 0 1 1 1 1 1 1 1 1 1 1 1 1 1 1 1 0 1 1 1 1 1 0 1 0 1 1 1 1 1 1 1 1 1 1 1 1 1 0 1 1 1 1 1 1 1 1 0 1 1 1 1 0 1 1 1 1 1 0 1 1 1 1 1 1 1 0 0 1 1 1 1 1 0 0 1 1 1 1 1 1 Memory Management — Paging Free Hand Vhand Process Reference Hand 1 = Page is being referenced 0 = Page is NOT being referenced F = Freed Memory Page by vhand process Memory
Paging and Process Deactivation Non-Kernel memory Paging begins with possibility of stabilization. Free Mem Pages LOTSFREE Paging continues at maximum rate, with no possibility of stabilization. DESFREE MINFREE Process deactivation begins to occur. 0 MB Paging Scanning Rate
The Buffer Cache • Pool of memory designed to retain the most commonly accessed files from disk • Used only for file system I/O (not raw I/O) • Size of buffer cache controlled bydbc_min_pctanddbc_max_pct Buffer Cache Filesystem Process File Memory
The syncer Daemon • All entries stay in the buffer cache for a minimum of 30 seconds before being flushed. • The syncer daemon runs once every 6 seconds and flushes 20% of the buffer cache to disk. Buffer Cache Filesystem flushes File syncer Memory
Shared Memory Segment Shared Memory Segment Memory Text Text Data Data Sh. Mem Sh. Mem Sh. Lib Sh. Lib IPC Memory Allocation # ipcs -mob IPC status from /dev/kmem as of Sat Feb 14 06:53:27 1998 T ID KEY MODE OWNER GROUP NATTCH SEGSZ Shared Memory: m 5 0x06347849--rw-rw-rw- root root 0 77384 m 7 0x000c0568 --rw------- root root 2 131516
Memory Metrics to Monitor — Systemwide • Size of dynamic buffer cache • Size of IPC memory segments • Amount of free memory relative to - LotsFree - DesFree - MinFree • Paging to swap device • Number of process deactivations • Pages scanned by vhand (SR) • Pages freed by vhand (FR)
Memory Metrics to Monitor — per Process • Size of RSS/VSS • Size of text, data, and stack segments • Number of shared memory segments • Amount of time blocked on virtual memory
Memory Monitoring vmstat Output #=> vmstat -n 5 VM memory page faults avm free re at pi po fr de sr in sy cs 9140 3824 3 4 0 0 0 0 0 675 824 140 CPU cpu procs us sy id r b w 9 5 86 1 100 0 9017 3500 41 49 11 0 0 0 0 1257 2823 329 24 17 60 0 100 0 10292 2255 65 20 41 0 0 0 0 1419 3795 481 67 24 9 5 102 0 10227 976 89 19 85 0 0 0 0 1698 4771 641 67 33 0 7 103 0 10958 400 81 12 91 48 26 0 194 1791 5847 697 67 31 3 8 110 0 10759 454 33 3 98 51 24 0 268 1598 4313 598 62 20 18 6 111 0 13448 404 21 0 65 74 39 0 282 1021 3175 354 32 15 53 0 118 0
Memory Monitoring glance — Memory Report B3692A GlancePlus B.10.12 17:33:59 e2403roc 9000/856 Current Avg High -------------------------------------------------------------------------------- CPU Util S SN NU | 22% 29% 51% Disk Util F | 1% 7% 13% Mem Util S SU UB B | 91% 91% 91% Swap Util U UR R | 25% 24% 35% -------------------------------------------------------------------------------- MEMORY REPORT Users= 19 Event Current Cumulative Current Rate Cum Rate High Rate -------------------------------------------------------------------------------- Page Faults 78 287 7.5 24.3 139.3 Paging Requests 3 21 0.2 1.7 12.0 KB Paged In 52kb 336kb 5.0 28.4 189.3 KB Paged Out 0kb 0kb 0.0 0.0 0.0 Reactivations 0 0 0.0 0.0 0.0 Deactivations 0 0 0.0 0.0 0.0 KB Reactivated 0kb 0kb 0.0 0.0 0.0 KB Deactivated 0kb 0kb 0.0 0.0 0.0 VM Reads 3 6 0.2 0.5 2.0 VM Writes 0 0 0.0 0.0 0.0 Total VM : 78.9mb Sys Mem : 10.6mb User Mem: 78.0mb Phys Mem: 128.0mb Active VM: 23.4mb Buf Cache: 19.1mb Free Mem: 20.3mb Page 1 of 1
Memory Monitoring glance — Process List B3692A GlancePlus B.10.12 14:52:27 e2403roc 9000/856 Current Avg High -------------------------------------------------------------------------------- CPU Util S SN NU | 22% 29% 51% Disk Util F | 1% 7% 13% Mem Util S SU UB B | 91% 91% 91% Swap Util U UR R | 25% 24% 35% -------------------------------------------------------------------------------- PROCESS LIST Users= 11 User CPU Util Cum Disk Block Process Name PID PPID Pri Name ( 100 max) CPU IO Rate RSS On -------------------------------------------------------------------------------- netscape 16013 12988 154 sohrab 12.9/14.0 64.9 0.0/ 0.6 14.7mb SLEEP supsched 18 0 100 root 2.9/ 2.1 942.6 0.0/ 0.0 16kb IPC lmx.srv 1219 1121 154 root 1.6/ 0.9 389.4 0.5/ 0.0 2.7mb SLEEP glance 15726 15396 156 root 0.6/ 0.9 2.0 0.0/ 0.2 4.0mb TERM statdaemon 3 0 128 root 0.6/ 0.7 302.1 0.0/ 0.0 16kb SLEEP midaemon 1051 1050 50 root 0.4/ 0.4 201.4 0.0/ 0.0 1.3mb SYSTM ttisr 7 0 -32 root 0.4/ 0.3 121.0 0.0/ 0.0 16kb TERM dtterm 15559 15558 154 roc 0.4/ 0.4 1.6 0.0/ 0.0 6.2mb SLEEP rep_server 1098 1084 154 root 0.2/ 0.1 23.7 0.0/ 0.0 2.0mb SOCKT syncer 325 1 154 root 0.2/ 0.0 20.2 0.1/ 0.0 1.0mb SLEEP xload 13569 13531 154 al 0.2/ 0.0 2.4 0.0/ 0.0 2.6mb SLEEP Page 1 of 13
Memory Monitoring glance — Individual Process B3692A GlancePlus B.10.12 15:17:52 e2403roc 9000/856 Current Avg High -------------------------------------------------------------------------------- CPU Util S SN NU | 22% 29% 51% Disk Util F | 1% 7% 13% Mem Util S SU UB B | 91% 91% 91% Swap Util U UR R | 25% 24% 35% -------------------------------------------------------------------------------- Resource Usage for PID: 16013, netscape PPID: 12988 euid: 520 User:sohrab -------------------------------------------------------------------------------- CPU Usage (sec) : 3.38 Log Reads : 166 Rem Log Rds/Wts: 0/ 0 User/Nice/RT CPU: 2.43 Log Writes: 75 Rem Phy Rds/Wts: 0/ 0 System CPU : 0.73 Phy Reads : 4 Interrupt CPU : 0.14 Phy Writes: 61 Total RSS/VSS : 22.4mb/ 28.3mb Cont Switch CPU : 0.08 FS Reads : 4 Traps / Vfaults: 414/ 8 Scheduler : HPUX FS Writes : 29 Faults Mem/Disk: 0/ 0 Priority : 154 VM Reads : 0 Deactivations : 0 Nice Value : 24 VM Writes : 0 Forks & Vforks : 0 Dispatches : 1307 Sys Reads : 0 Signals Recd : 339 Forced CSwitch : 460 Sys Writes: 32 Mesg Sent/Recd : 775/ 1358 VoluntaryCSwitch: 814 Raw Reads : 0 Other Log Rd/Wt: 3924/ 957 Running CPU : 0 Raw Writes: 0 Other Phy Rd/Wt: 0/ 0 CPU Switches : 0 Bytes Xfer: 410kb Proc Start Time Wait Reason : SLEEP Fri Feb 6 15:14:45 1998
Memory Monitoring glance — System Tables B3692A GlancePlus B.10.12 15:26:15 e2403roc 9000/856 Current Avg High -------------------------------------------------------------------------------- CPU Util S SN NU | 22% 29% 51% Disk Util F | 1% 7% 13% Mem Util S SU UB B | 91% 91% 91% Swap Util U UR R | 25% 24% 35% -------------------------------------------------------------------------------- SYSTEM TABLES REPORT Users= 19 System Table Available Used Utilization High(%) -------------------------------------------------------------------------------- Proc Table (nproc) 276 173 63 63 File Table (nfile) 1610 706 44 45 Semaphore Table (semmni) 64 8 13 13 File Locks (nflocks) 200 17 9 9 Psuedo Terminals (npty) 60 5 8 8 Buffer Headers (nbuf) na 3780 na na Inode Cache (ninode) 476 na 476 476 Shared Memory 12.5gb 3.6mb na na Buffer Cache 16.8mb na 16.8mb 18.4mb Buffer Cache Min 6.4mb Buffer Cache Max 64.0mb Page 1 of 2
Tuning a Memory-Bound System — Hardware Solutions • Add more physical memory • Reduce usage of X-terminals
Tuning a Memory-Bound System — Software Solutions • Look for unnecessary processes - Extra windows - Screen Savers - Long strings of child processes • Reduce dbc_max_pct (max size of dynamic buffer cache). • Identify programs with memory leaks. • Check for unreferenced shared memory segments. • Use serialize command to reduce process thrashing. • Use PRM to prioritize memory allocation.
Memory resource PA-RISC Access Control Control Register resident Access ID keys Access ID keys stored in the kernel tables
The serialize Command Kernel Swap Space OS Tables Proc I Proc J Proc K Proc L Proc A Proc B Proc C Proc D Proc E Proc F Space for 1 more process Proc G Proc H Memory