1 / 21

Urban Transportation Planning

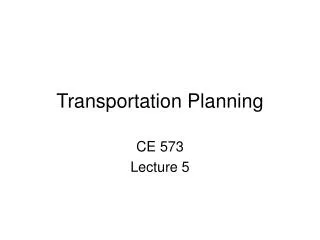
Urban Transportation Planning. Characteristics of Urban Personal Travel. National Household Travel Survey. Last conducted in 2001-2002 66,000 samples (40,000 from add-ons) Short-trips, 24-hours Long-trips, 28 days Previous surveys at about 5 year intervals Telephone Interview.

zamora
Download Presentation

Urban Transportation Planning

An Image/Link below is provided (as is) to download presentation Download Policy: Content on the Website is provided to you AS IS for your information and personal use and may not be sold / licensed / shared on other websites without getting consent from its author. Content is provided to you AS IS for your information and personal use only. Download presentation by click this link. While downloading, if for some reason you are not able to download a presentation, the publisher may have deleted the file from their server. During download, if you can't get a presentation, the file might be deleted by the publisher.

E N D

Presentation Transcript


  1. Urban Transportation Planning Characteristics of Urban Personal Travel

  2. National Household Travel Survey • Last conducted in 2001-2002 • 66,000 samples (40,000 from add-ons) • Short-trips, 24-hours • Long-trips, 28 days • Previous surveys at about 5 year intervals • Telephone Interview

  3. Sample Data from 1995 NPTS • SAMPLE.xls

  4. Web Resources • Oak Ridge’s NHTS Query Site • https://nhts.ornl.gov/2001/Login.do • NHTS Page • http://www.bts.gov/programs/national_household_travel_survey/ • Old Surveys • http://www.surveyarchive.org/

  5. Census Transportation Planning Package (CTPP) • Data from the Census long form • Journey to Work • Place of Work • Organized by TAZ

  6. Questions to Ask When Reading Travel Statistics • What are the trends? • What direction is desirable (helps meet goals)? • Can the numbers be affected by infrastructure? • Can the numbers be affected by policy?

  7. Mean Number of Vehicles by Household Size

  8. Percent of Households with Zero Vehicles

  9. Mode of Transportation for Commute to Work

  10. Percent of Vehicles by Type

  11. Mean Daily Trips by Age

  12. Percent of Trips by Mode

  13. Percent of Trips by Purpose

  14. Percent of Trips by Time of Day

  15. Mean Occupants by Trip Purpose

  16. Mean Trip Length by Age of Driver

  17. Mean Number of Drivers, Vehicles and Bicycles per Household

  18. Mode of Transportation to Work

  19. Mean Number of Trips by Demographic Category

  20. Percent of Trips by Day of Week

  21. Travel Time for All Trips Purposes

More Related