Download
1 / 19

E N D
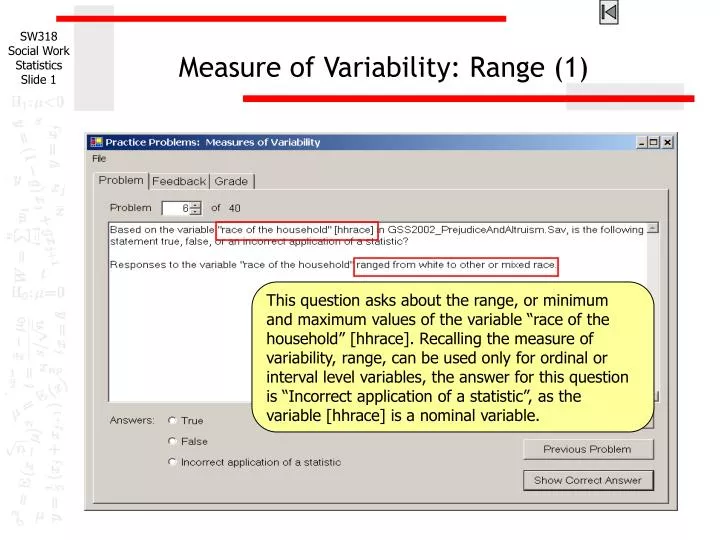
Measure of Variability: Range (1) This question asks about the range, or minimum and maximum values of the variable “race of the household” [hhrace]. Recalling the measure of variability, range, can be used only for ordinal or interval level variables, the answer for this question is “Incorrect application of a statistic”, as the variable [hhrace] is a nominal variable.
Measure of Variability: Range (2) To determine whether range is a correct use of a statistic for the variable [class], we have to check the level of measurement of the variable [class]. Recall that the use of range is only for ordinal or interval variables.
Measure of Variability: Range (3) By checking the value labels of the variable [class], we now know that the variable [class] is an ordinal level variable of which categories are rank ordered from “lower class” to “upper class”. Thus, range is a correct measure of variability for [class].
Measure of Variability: Range (4) In SPSS, you can obtain a range information of variables of interest using “Frequencies” function. It can be implemented by clicking: Analyze > Descriptive Statistics > Frequencies In other words, first, click on Analyze in the menu bar of SPSS, then find and click on Descriptive Statistics on a pop-down submenu. Again, find and click on Frequencies on another pop-down submenu. Then, you will see a window shown in the next slide.
Measure of Variability: Range (5) After moving the variable [class] to the “Variable(s):” box on the right, click on “Statistics…” button on the bottom.
Measure of Variability: Range (6) In the next pop-up window “Frequencies: Statistics”, there are a list of variability measures including “range”. You select “Range” and then click on “Continue” button (You might want to select the “Minimum” and “Maximum” too to get the exact values). Take a careful look at variability options here, you will have to come back to this window later.
Measure of Variability: Range (7) The SPSS output window presents that the range value of the variable [class] is 3 with the minimum value of 1, “Lower Class”, and the maximum value of 4, “Upper Class”. You can state the range of the variable [class] like following: The survey respondents’ subjective class identification ranged from “Lower Class” to “Upper Class”.
Measure of Variability: Standard Deviation (1) This question asks the standard deviation of the variable “frequency of attendance at religious services” [attend]. Recall that the use of standard deviation as a measure of variability requires the variable to be an interval level variable.
Measure of Variability: Standard Deviation (2) The variable [attend] was measured using values from 0 “never” to 8 “more than once a week”, which is an ordinal level variable. Thus, the standard deviation is an incorrect application of a statistic.
Measure of Variability: Standard Deviation (3) The variable “number of hours per day spent watching TV” [tvhours] is an interval level variable and, thus, using standard deviation to measure the variability is a correct use of a statistic.
Measure of Variability: Standard Deviation (4) Recall that there are various options for the measure of variability you can choose from in SPSS. You can obtain the measure of variability using Frequencies function.
Measure of Variability: Standard Deviation (5) After moving the variable [tvhours] to the “Variable(s):” box on the right, click on “Statistics…” button on the bottom.
Measure of Variability: Standard Deviation (6) Select “Std. deviation” to get the standard deviation and click on “Continue” and “OK” in the following window.
Measure of Variability: Standard Deviation (7) The SPSS output result shows that the standard deviation of “number of hours per day spent watching TV” in this survey was 2.673 (hours).
Measure of Variability: Application of Standard Deviation (1) We’ve learned two key statistics: central tendency and variability. Using these two statistics, we can infer (or guess) the relative position of scores in the distribution. In most distributions (with relatively large number of cases), about 34 percent of all scores fall between the mean and one standard deviation above the mean. You will have to use this information to solve this problem.
Measure of Variability: Application of Standard Deviation (2) Recall that we need two statistics, mean and standard deviation, to solve the problem. Use Frequencies function in SPSS and select “Std. deviation” in “Dispersion” box and “Mean” in “Central Tendency” box in “Frequencies: Statistics” window.
Measure of Variability: Application of Standard Deviation (3) The SPSS output result shows that mean and standard deviation of the [tvhours] are 3.25 and 2.673, respectively. Using these numbers, we would reasonably expect about 68 percent, or two-thirds of the survey respondents spent from 0.58 (3.25-2.673) to 5.92 (3.25+2.673) hours per day watching TV.
Steps in solving variability problems - 1 The following is a guide to the decision process for answering variabilityhomework problems. If the problem asks about a specific measure of variability: Is the level of measurement required for the statistic satisfied? No Incorrect application of a statistic Yes Is the correct value for the statistic reported? No False Yes True
Yes No Yes Steps in solving variability problems - 2 If the problem asks whether or not 2/3 of the cases fell between some low and high score (requires mean and standard deviation): Is the variable interval level? No Incorrect application of a statistic Is the low score the mean – standard deviation? No False False Is the high score the mean + standard deviation? No False True