Download
1 / 25
250 likes | 348 Views
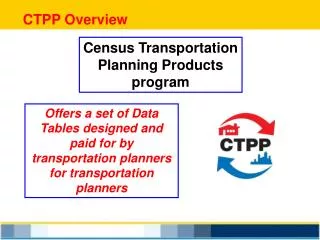
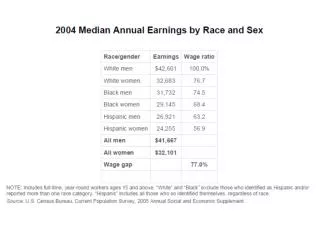
Census Transportation Planning Products CTPP 2006-2010 Access Software. I want to get Means of transportation table for all counties in Pennsylvania Table used in this example A102106 Means of transportation Universe: Residence: Workers 16 years and over . Solution

E N D
Census Transportation Planning ProductsCTPP 2006-2010 Access Software
I want to get Means of transportation table for all counties in Pennsylvania • Table used in this example • A102106 Means of transportation • Universe: Residence: Workers 16 years and over
Solution (step-by-step illustration)
Open CTPP software web page and Sign In (or Register) (http://ctpp.transportation.org/Pages/5-Year-Data.aspx)
Select Data set option. Only 2006-2010 data are available now.
Select Residence: Workers 16 years and over – Set A (from microdata) option.
Select A102106 - Means of transportation (18) (Workers 16 years and over) option.
Geography Selection: Step 1 Click RESIDENCE in the following page .
Geography Selection: Step 2 Click State-Countythen click Clear Full Selection on the top right corner of the following page.
Geography Selection: Step 3 Select Show state descendants from the option in Show valid flow members | More options.
Geography Selection: Step 4 Select Pennsylvania from the drop down list in View state descendants and click OK when done.
Geography Selection: Step 5 Click Select All on the top right corner of the following page.
Geography Selection: Step 6 Click Save selection set and enter the set name in the input box Set name (shown on the right below)
Click Show data on the top right corner of the following page.
Click Saved Tables and Charts tab and the name of the saved report is shown. Further operation, such as Delete, can be done by checking the check box next to the report name and clicking Delete.
Click My selection sets tab and the name of the saved selection set is shown. Further operation, such as Delete, can be done by checking the check box next to the selection set name and clicking Delete.
Going back to the report page and clicking Map leads to the map view of the data in the report.
Select Foreground – Graduated Symbols from the drop down list in SHOW USING under ADD THEMATIC ANALYSIS. Choose Total, means of transportation under VARIABLESand click OK. The total results are shown in the map as shown in the bottom right figure below.
Select different options in means of transportation 18 under VARIABLES and the corresponding results are shown in the map as shown in the figure on the right below.