Download
1 / 22
220 likes | 296 Views
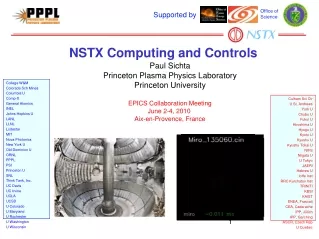
NSTX-U. Supported by . Structure, Amplitude and Identification of CAEs and GAEs in NSTX. Neal A. Crocker E. Belova , E. D. Fredrickson, N. N. Gorelenkov , W . A. Peebles, S. Kubota, R . E. Bell, B. P. LeBlanc, J . E. Menard, M. Podestà , K. Tritz and H . Yuh.

E N D
NSTX-U Supported by Structure, Amplitude and Identification of CAEs and GAEs in NSTX Neal A. Crocker E. Belova, E. D. Fredrickson, N. N. Gorelenkov, W. A. Peebles, S. Kubota, R. E. Bell, B. P. LeBlanc, J. E. Menard, M. Podestà, K. Tritzand H. Yuh Coll of Wm & Mary Columbia U CompX General Atomics FIU INL Johns Hopkins U LANL LLNL Lodestar MIT Lehigh U Nova Photonics ORNL PPPL Princeton U Purdue U SNL Think Tank, Inc. UC Davis UC Irvine UCLA UCSD U Colorado U Illinois U Maryland U Rochester U Tennessee U Tulsa U Washington U Wisconsin X Science LLC Culham Sci Ctr York U Chubu U Fukui U Hiroshima U Hyogo U Kyoto U Kyushu U Kyushu Tokai U NIFS Niigata U U Tokyo JAEA Inst for Nucl Res, Kiev Ioffe Inst TRINITI Chonbuk Natl U NFRI KAIST POSTECH Seoul Natl U ASIPP CIEMAT FOM Inst DIFFER ENEA, Frascati CEA, Cadarache IPP, Jülich IPP, Garching ASCR, Czech Rep 54th Annual Meeting of the APS Div. of Plasma Physics October 29 - November 2, 2012 Providence, Rhode Island
Observed ce enhancement motivates measurement and identification of high frequency AEs [D. Stutman et al., PRL 102 115002 (2009)] • Beam-ion-excited high frequency Alfvén Eigenmodes (AE)correlate with enhanced core ce • posited cause: resonant interaction of multiple modeswith electron • High frequency AE structure measured with reflectometer array • Measurements reveal two kinds of mode • Local dispersion relations help identify modes • Two kinds of mode are CAEs and GAEs • Measurements consistent with transport hypothesis[N. N. Gorelenkov et al., Nucl. Fusion 50, 084012 (2010)]
AE radial structure measured with array of reflectometers • Reflectometer measures path length change (L) of microwaves reflected from plasma • Microwaves reach cutoff at 2 = p2 = e2n0/0me • For large scale modes, cutoff displaces due to n at cutoff ⇒ “effective displacement” x≡L/2 approximates cutoff displacement magnetic axis
Measurements reveal two kinds of high frequency AEs • Structure measured with reflectometer array • Toroidal mode number (n) measured with edge dbtoroidal array • Structures tend to fall in two categories: • broad structure, peaking toward core • mostly f < ~ 600 kHz, n = -6 – -8 • strongly core localized • mostly f > ~ 600 kHz, n = -3 – -5
Broad structure (f < ~ 600 kHz) modes are GAEs For “GAEs”, fGAE predicts fmode well Equilibrium trends q0 • GAEs are shear Alfvén: • peak at weak shear, e.g. at axis • Strongq0variation ⇒ comparison with fGAE(t) stringent test of identity • Fit to fGAE(t)⇒ m • fGAE(t) sensitive to m/qif |m| >> 1 • q0 varies substantially (1.7 – 1.1) over t = 400 – 700 ms • Modes with f < ~ 600 kHz: f(t) ~ fGAE(t) • Modes with f > ~ 600 kHz:f(t) NOT consistent with fGAE(t)
Strongly core localized modes are CAEs CAE “well” f = 633 kHz, n = -4 (shot 141398, t = 582 ms) V < 0 • Compressional Alfvén waves propagate ONLY where: • “Well” formed in R–Z plane • CAE must fit inside “well” • V ⇒ R-Z “wavelength”: • Well width & lR-Z compared • lR-Z calculated at deepest point in well • Width (DR) determined in midplane • Toroidal Doppler shift taken into account • Modes with f > ~ 600 kHz: ”well” is sufficiently deep • Modes with f < ~ 600 kHz: no “well”, or “well” too shallow
Measurements consistent with ORBIT modeling prediction for enhanced ce • ORBIT modeling ⇒ ceenhancement due to resonant electron interaction with multiple modes [N. N. Gorelenkov et al., Nucl. Fusion 50, 084012 (2010)] • total fluctuation level needed to explain ce ehancement: a= dA||/B0R0= 4 x 10⁻⁴ • threshold at ~ 15 modes • For GAEs, a = 3.4 x 10⁻⁴ in core, consistent with prediction • for shear Alvén modes: xr = dBr/ik||B0 = aR0kq/k|| • xr estimated by reflectomter |x| @ R = 1.16 m • k|| &kqestimated using shear dispersion relation • Number of modes (including CAEs) is 15, consistent with prediction
Summary • Observed ce enhancement motivates measurement and identification of high frequency AEs • Measurements reveal two kinds of mode • broad structure, mostly f< ~ 600 kHz, n = -6 – -8 • strongly core localized, mostly f > ~ 600 kHz, n = -3 – -5 • Local dispersion relations help identify modes • broad structure modes are GAEs • strongly core localized modes are CAEs • Amplitude and number of modes consistent with hypothesis for ce enhancement, resonant interaction with multiple modes. Future Work • Use measurements to guide ORBIT modeling to predict ce(K. Tritz, GO6.00004) • Validate simulations of HYM code (E. Belova, PP8.00022)
Overview • Motivation: beam-ion-excited high frequency Alfvén Eigenmodes (AE)correlate with enhanced core ce[D. Stutman et al., PRL 102 115002 (2009)] • posited cause: resonant interaction in presence of multiple modes • Structure measurements: high frequency AE structure measured with reflectometer array • Measurements reveal two kinds of mode • Identification analysis: local dispersionrelations used with f & n to identify modes • Two kinds of mode are CAEs (f > ~ 600 kHz) and GAEs (f< ~ 600 kHz) • Comparison with transport hypothesis:[N. N. Gorelenkov et al., Nucl. Fusion 50, 084012 (2010)] • Amplitude and number of modes consistent with posited cause of enhanced core electron thermal transport
High frequency AEs proposed as causeof observedce enhancement [D. Stutman et al., PRL 102 115002 (2009)] • high f AE activity in core of NSTX beam-heatedplasmas – correlates with enhanced ce • f~ fbe ~ 600 kHz ⇒ resonant orbit modification • fbe ≡ trapped electron bounce frequency • High f AEs identified as GAEs • GAE core localization expected ⇒ active in region of enhanced ce • Orbit modeling ⇒ significant ce enhancement from multiple modes [N. N. Gorelenkov et al., Nucl. Fusion 50, 084012 (2010)] • threshold at ~ 15 modes
AE radial structure measured with array of reflectometers • Reflectometer measures path length change of microwaves reflected from plasma • Microwaves propagate to “cutoff” layer, where density high enough for reflection (2 = p2 = e2n0/0me) • for large scale modes, cutoff displaces due to n at cutoff ⇒ “effective displacement” x≡/2kvac approximates cutoff displacement • = phase between reflected and launched waves changes • Two arrays of reflectometers: • Q-band: 8 channels — 30–50 GHz • V-band: 8 channels — 55–75 GHz • Cutoffs span large radial range in high density plasmas (n0 ~ 1 – 7 x 10¹⁹ m-3)
Measurements reveal two kinds of high frequency AEs in H-mode beam-heated plasmas • Effective displacement (x) measured at 16 radii with reflectometer array • shear AEs: x dominated by displacement of n0 • compressional AEs: compressional ncontributes to x • Toroidal mode number (n) measured with dbqedge toroidal array • 12 locations, irregular spacing (Df) • 10° ≤ Df ≤ 180° ⇒ resolves |n| ≤ 18 • Modes structures tend to fall in two categories: • broad structure, peaking toward core with significant edge |x| • mostly f < ~ 600 kHz, n = -6 – -8 • typically larger core |x| & larger edge db (2) strongly core localized, vanishing edge |x| • mostly f > ~ 600 kHz, n = -3 – -5 • typically larger larger core |x| & smaller edge db
Modes can be identified as CAEs or GAEs via mode number and frequency evolution AE frequency evolution Equilibrium trends db 141398 n=-4 n=-3 n=-3 n=-8 q0 • Dispersion relation parameters measured: • q0 and B0 from equilibrium reconstruction using magnetic field pitch from Motional Start Effect • ne0 measured via Multipoint Thomson Scattering • Alfvén velocity, vA0 = B0/(m0r0)½ • r0=mDne0,mD=Deuterium mass • Toroidal rotation frequency, fROT0, from Charge Exchange Recombination Spectroscopy • For GAEs, expect f(t)consistent with local shear Alfvén dispersion relation, but not CAEs • Expect CAEs to fit in CAE “well”, but not GAEs • compressional Alfvén waves propagate ONLY where: • “wavelength” in R-Z plane must fit inside “well”
Sensitivity of fGAE to q0 helps distinguish CAEs & GAEs For “GAEs”, fGAE predicts fmode well For “CAEs”, fGAE predicts fmode poorly • GAEs are shear Alfvén: • fGAE(t) sensitive to m/q0 if |m| >> 1 • q0 varies substantially (1.7 – 1.1) over t = 400 – 700 ms • Modes with f < ~ 600 kHz, n = -6 – -8: f(t) ~ fGAE(t) • |n| >> 1 ⇒ low |m| ⇒fGAEinsensitive to q0 • Modes with f > ~ 600 kHz, n = -3 – -5:f(t) NOT consistent with fGAE(t) • low |n|, high f⇒ high |m| ⇒strong q0 sensitivity
For identification as CAE, sufficiently wide & deep “well” must exist for mode with measured f and n CAE “well” for f = 633 kHz, n = -4 (shot 141398, t = 582 ms) • For n ≠ 0, compressional Alfvén “well” formed: • compressional Alfvén waves propagate ONLY where: • CAE “wavelength” in R-Z plane must fit inside “well” • For observed modes, f & n used to determine well width and lR-Z • lR-Z calculated at deepest point in well • Width (DR) determined in midplane • Modes with f > ~ 600 kHz, n = -3 – -5 sufficiently wide and deep • Modes with f < ~ 600 kHz, n = -6 – -8 do not fit in “well” • For some f & n,(n/R)2vA2 – (w-nwROT) 2 > 0everywhere • For some f& n, lR-Z >> DR
Amplitude and number of modes consistent with ORBIT modeling prediction for enhanced ce • ORBIT modeling indicates significant ce enhancement due to resonant electron interaction of multiple modes [N. N. Gorelenkov et al., Nucl. Fusion 50, 084012 (2010)] • total fluctuation level needed to explain ce ehancement: a= dA||/B0R0= 4 x 10⁻⁴ • ce scales strongly with a⇒ bursty fluctuations give more cethan would expect from r.m.sa⇒ should evaluate time dependence carefully • threshold at ~ 15 modes • For modes with f < 600 kHz, calculated r.m.s. a = 3.4 x 10⁻⁴ in core, consistent with prediction for necessary fluctuation level • for shear Alvén modes: xr = dBr/ik||B0 = aR0kq/k|| • xr estimated by reflectomter |x| @ R = 1.16 m • k|| &kqestimated using f ≈ k||vA/2p + nfROT, kq = m/r, k|| = |m/q – n|/R, taking q = q0 and r = 1.16 m – R0 • Number of modes (including CAEs) is 15, consistent with prediction for necessary fluctuation level • Model needed for CAE effect on ce
AE radial structure measured with array of reflectometers NSTX cross-section • Two arrays: “Q-band” & “V-band” • Q-band: 30, 32.5, 35, 37.5, 42.5, 45, 47.5 & 50 GHz • V-band: 55, 57.5, 60, 62.5, 67.5, 70, 72.5 & 75 GHz • Arrays closely spaced (separated ~ 10° toroidal) • Single launch and receive horn for each array • Horns oriented perpendicular to flux surfaces ⇒frequency array = radial array • Cutoffs span large radial range in high density plasmas (n0 ~ 1 – 7 x 10¹⁹ m-3) Launch and Receive Horns (Interior View) 30-50 GHz ne from Multipoint Thomson Scattering 55-75 GHz (not shown: horns modified to optimize for frequency range)
Reflectometers used to measure local AE density fluctuation Microwave (“O-mode”) propagation electric field • Microwaves propagate to “cutoff” layer, where density high enough for reflection (p = ) • Dispersion relation of “ordinary mode”microwaves: 2 = p2 + c2k2, p2 proportional to density (p2 = e2n0/0me) • k 0 as p, microwaves reflect at k = 0 • Reflectometer measures path length change of microwaves reflected from plasma • phase between reflected and launched waves changes () • for large scale modes, cutoff displaces due to n at cutoff ⇒ “effective displacement” x≡ /2kvac approximates cutoff displacement
High frequency AEs commonly excited by beam ions in NSTX fc0 = 2.4 MHz db 141398 • High f AEs (f /fc0 > ~ 0.2) commonly observed in NSTX with reflectometers & edge db • Excited by Doppler-shifted resonance with beam ions • Edge dbq toroidal array typically shows |n| < ~ 15, propagation counter to beam ions (n< 0 ) • High f AE activity correlated with enhanced ce • Other significant effects on plasma • shown to cause fast-ion transport • postulated to cause ion heating
Future Work • Extend ORBIT modeling to include CAEs in prediction of ceenhancement • Use mode structure measurements to guide inputs to ORBIT modeling • Investigate effects of CAEs and GAEs on fast-ion transport using ORBIT modeling with measured mode structures • Compare CAE/GAE amplitude and structure measurements with theory predicting ion heating
Future Work • Use mode structure measurements to guide inputs to ORBIT modeling • see GO6.00004: “Investigation of CAE/GAE-induced electron thermal transport for NSTX-U”, K. Tritz • Validate CAE/GAE simulations of HYM (HYbrid kinetic and MHD) code • see PP8.00022: “Numerical Simulations of NBI-driven CAE modes in H-mode Discharges in NSTX”, E. Belova